


BTC index: March 2021
Plus a closer look at events in Turkey

The btc index is a little late this month owing to the events that have unfolded in Turkey. With a couple of weeks now having passed since the dismissal of the Central Bank Governor, has there been any notable changes showing up in the btc index? After answering this question during a country-specific spotlight we will then turn to an attempt to correlate btc index data with the Fragile States Index. Finally, the monthly regional charts are provided with some pointers as to where the most action has been happening around the world.
Top 5 movers for the month
Venezuelan Bolívar Fuerte (+30,733)
Zambian Kwacha (+0.76)
Belorussian Ruble (+0.65)
Japanese Yen (+0.33)
Hungarian Forint (+0.19)
Spotlight: Turkey
It has been a tumultuous macroeconomic year for Turkey, to say the least. The tumult hasn’t subsided with the governor of the Central Bank being dismissed two weeks ago - capital inflows have continued to slide (h/t @RobinBrooksIIF) - the Lira’s official exchange rate continues to fall - and inflation continues to climb (h/t Meltem Demirors).
The Turkish Lira is one of a small subset of currencies that consistently trades at or close to par with its official USD exchange rate. This means that the btc index regional charts hide this very interesting dynamic. It is even more notable because bitcoins traded during the first half of 2020 at a slight premium then swung to trade at a slight discount in the second half of the year. That discount has continued to widen into and beyond the new year 2021.
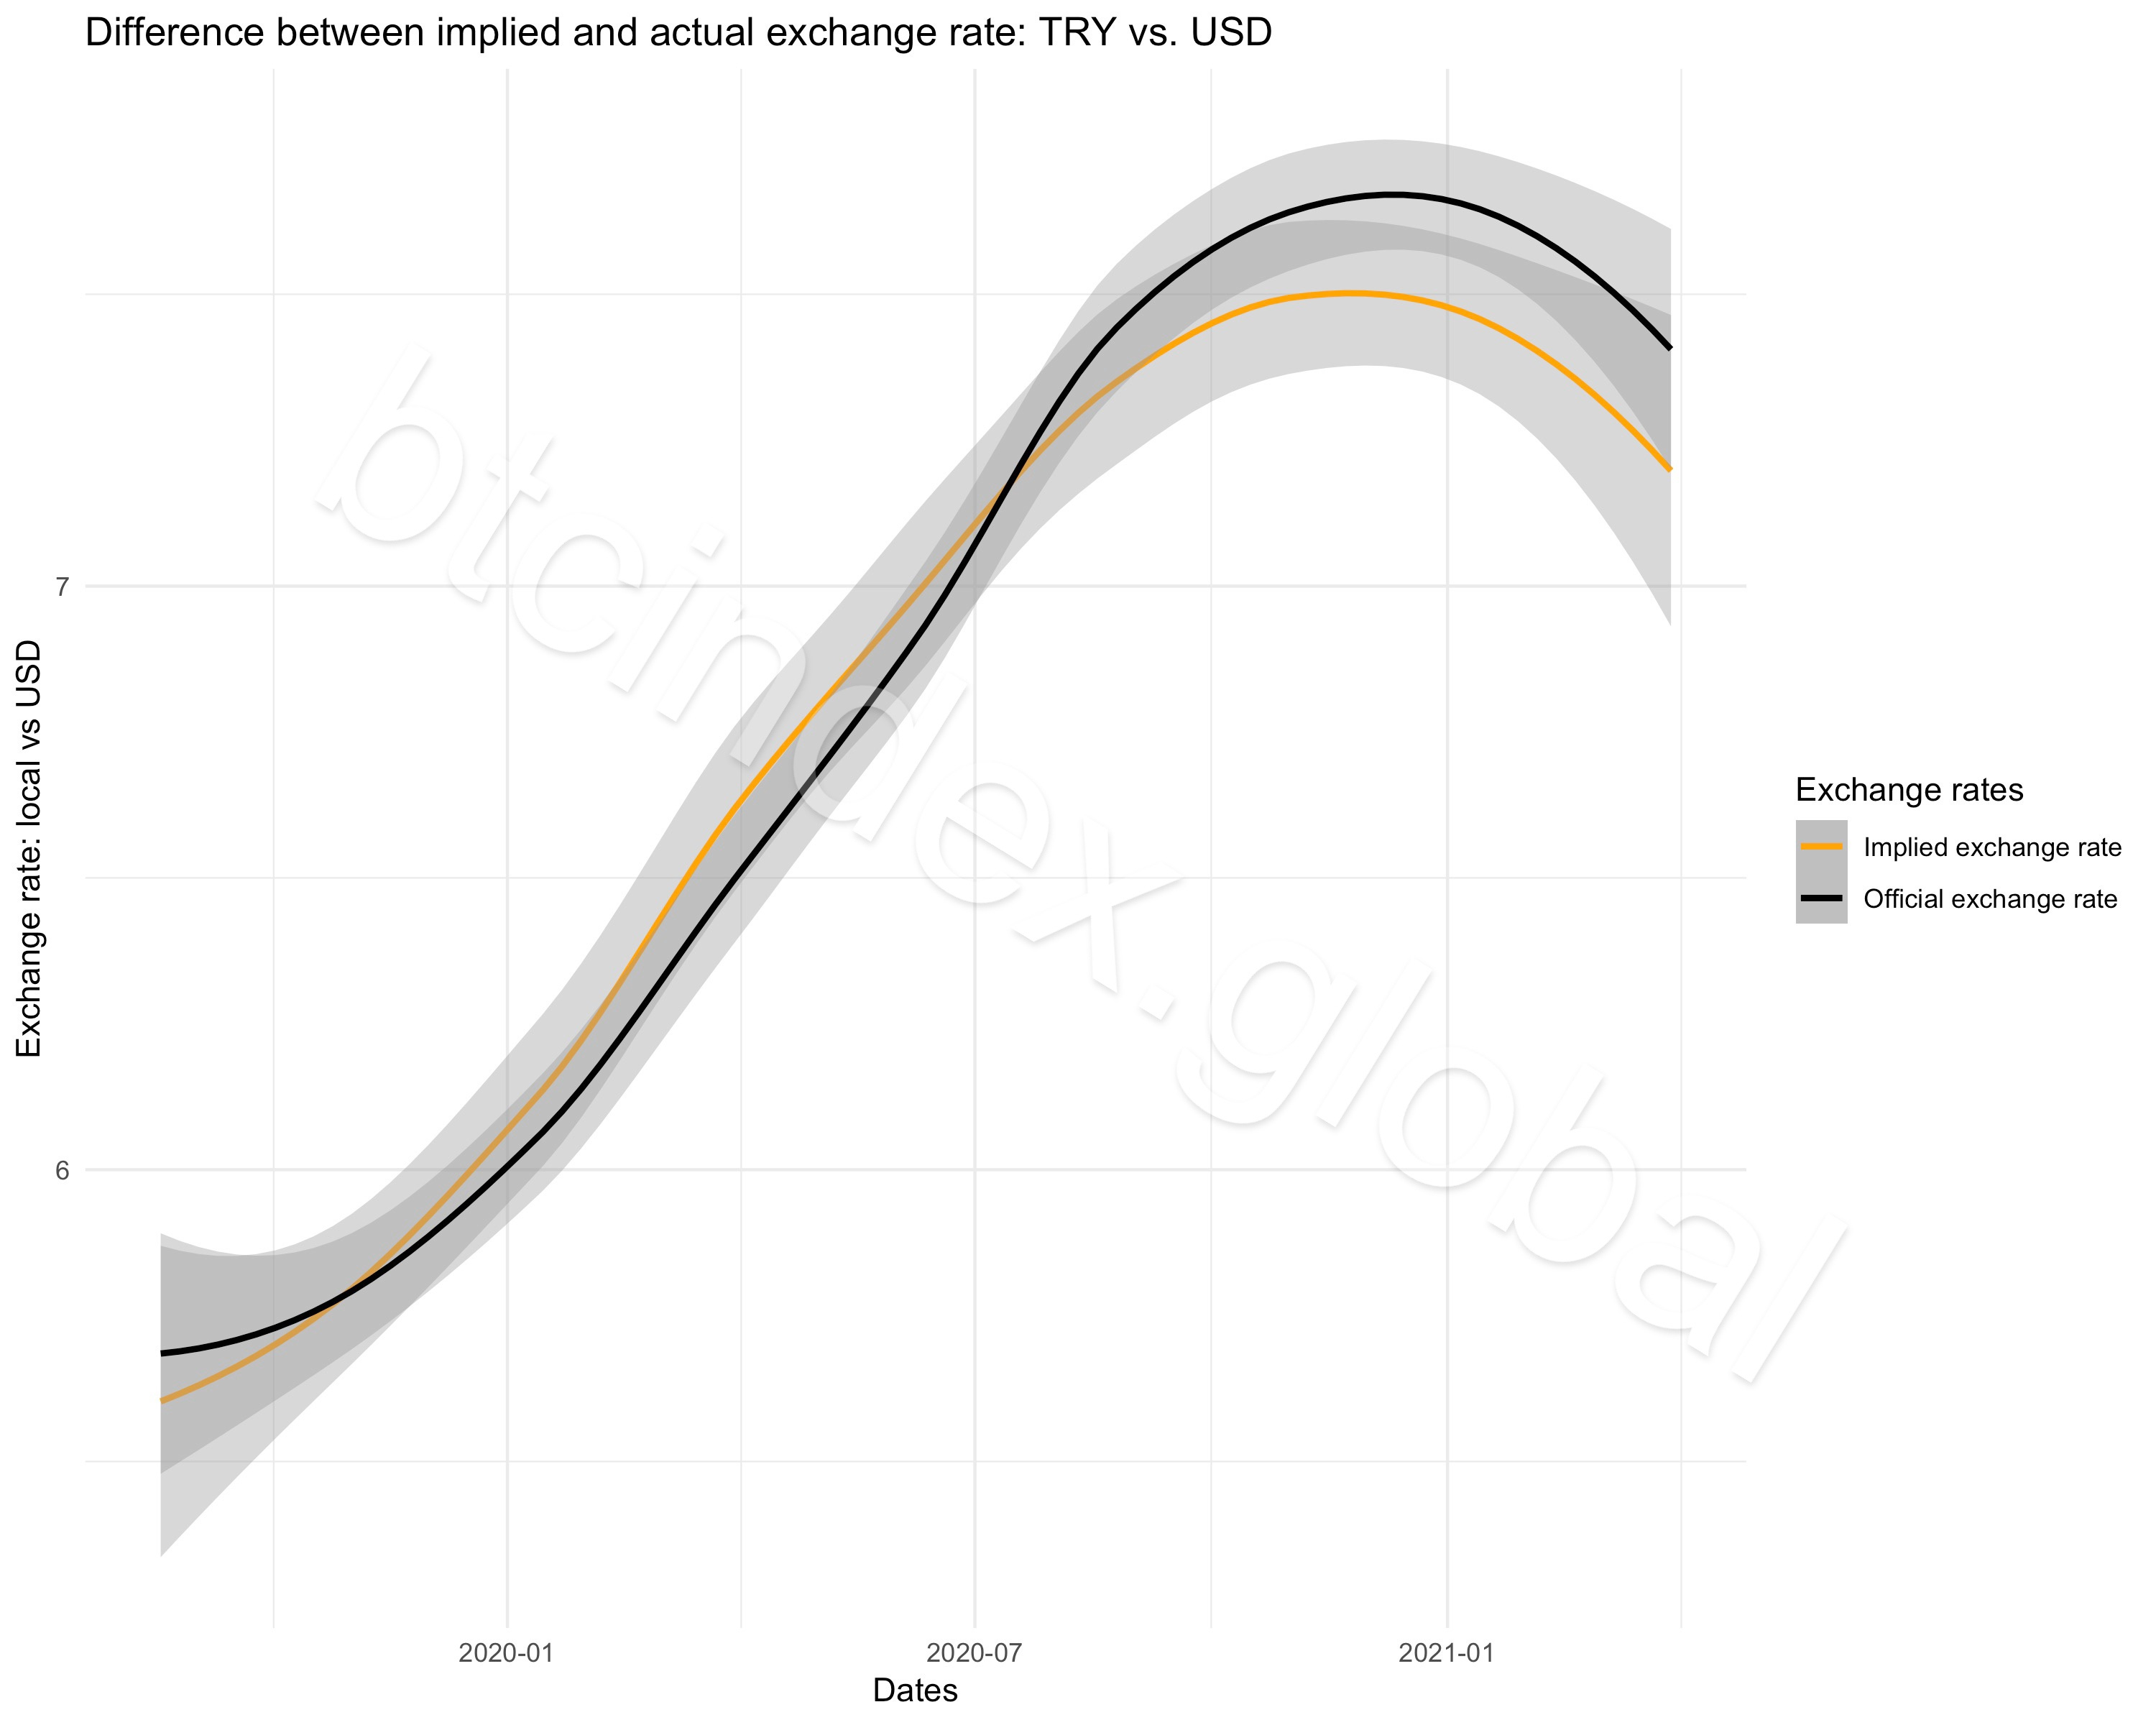
As painful as a depreciating currency is for those who have to purchase imported goods, and as painful as increasing interest rates are for those borrowing, the tight relationship between the official exchange rate and the btc index rate suggest that there was some prudent monetary policy implemented throughout 2020.
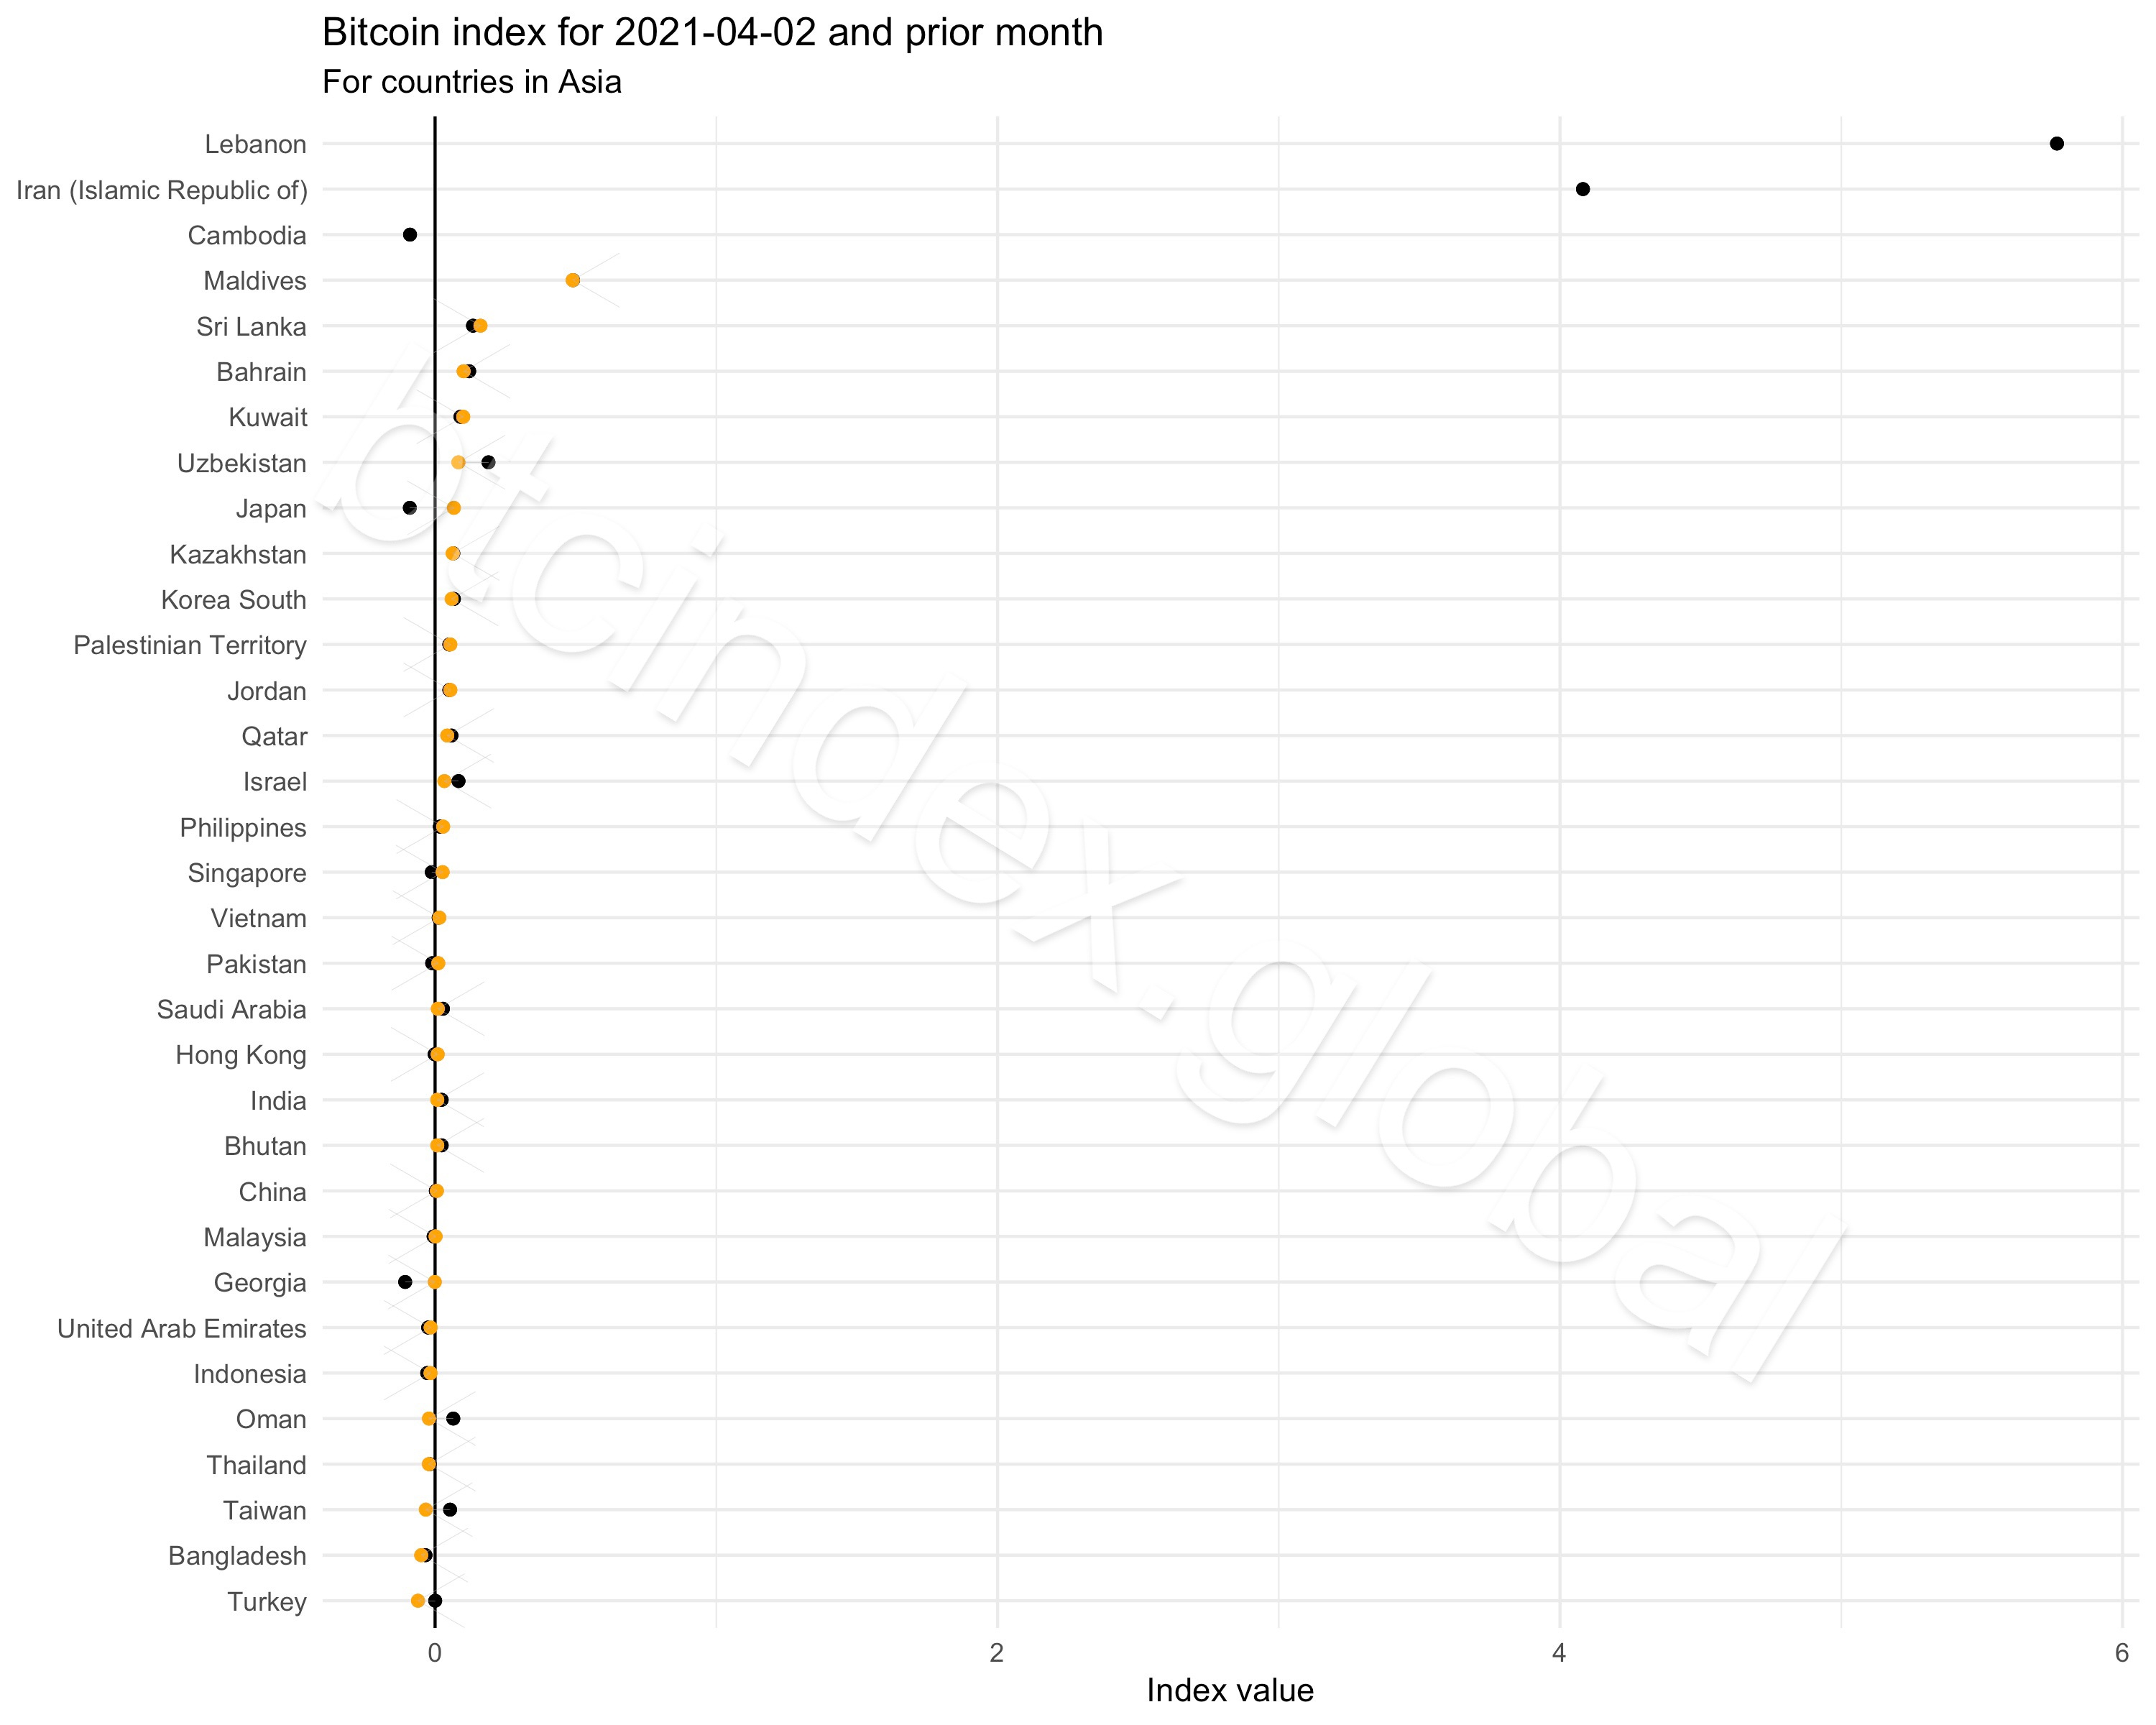
So prudent was the Central Bank’s policy, however, that its governor was dismissed two weeks ago. Since then a gap of +5% has opened between the implied exchange rate (8.19 TRY/USD) and the official exchange rate (7.76 TRY/USD). The average gap over the prior month was approximately ~3.3%. The volume of bitcoins exchanged has spiked both in peer-to-peer terms and also reportedly at some exchanges (h/t Messari). The btc index value for Turkey now sits at the bottom of all countries categorised in Asia (see in ‘regional charts’ further below) having gone from a btc index value of +0.027 at this time last month to -0.052 this month.
A concluding anecdote
It just so happens that the author found himself in Turkey over the summer of 2020. In the course of many conversations it became apparent that the depreciating Lira was pinching people hard. The solution that some had come up with was earning their pay in Euros or US dollars. Those who did not have this escape route could have instead purchased bitcoin - and the increasing volumes of bitcoin exchanged over the second half of 2020 suggest that some took this route. There is a reason why Turkey is the country with some of the highest ‘crypto adoption’ in the world (h/t Mónica Mena Roa @Statista).
This situation reminded me of conversations in Colombia a few years ago. People there sought foreign bank accounts where they could denominate their savings in US dollars. That route was not available to everyone - so alternatives had to be found. There is a reason why Colombia is the country with some of the largest volumes of peer-to-peer bitcoin exchange (h/t @Matt, UsefulTulips.org).
Exploring
The Fragile States Index is compiled by The Fund for Peace. It is a composite index that includes measures of ‘cohesion’ (e.g. security apparatus), political indicators (e.g. state legitimacy) and social indicators (e.g. demographic pressures). Some of these indicators are easier to measure than others. This means that the quality of the indicators can vary. Data are compiled and released each year with the most recent data available for 2020.
In addition to the indicators mentioned above, there are also economic indicators. They include: Economic Decline; Uneven Economic Development; and Human Flight and Brain Drain. After seeing a chart posted by Mira Christanto (@asiahodl), which plotted the 2020 index against the 5 year change in the index, it occurred to me that perhaps there might be an identifiable relationship between the 2020 Fragile States Index and the btc index.
Below is the output from this little exploratory exercise.
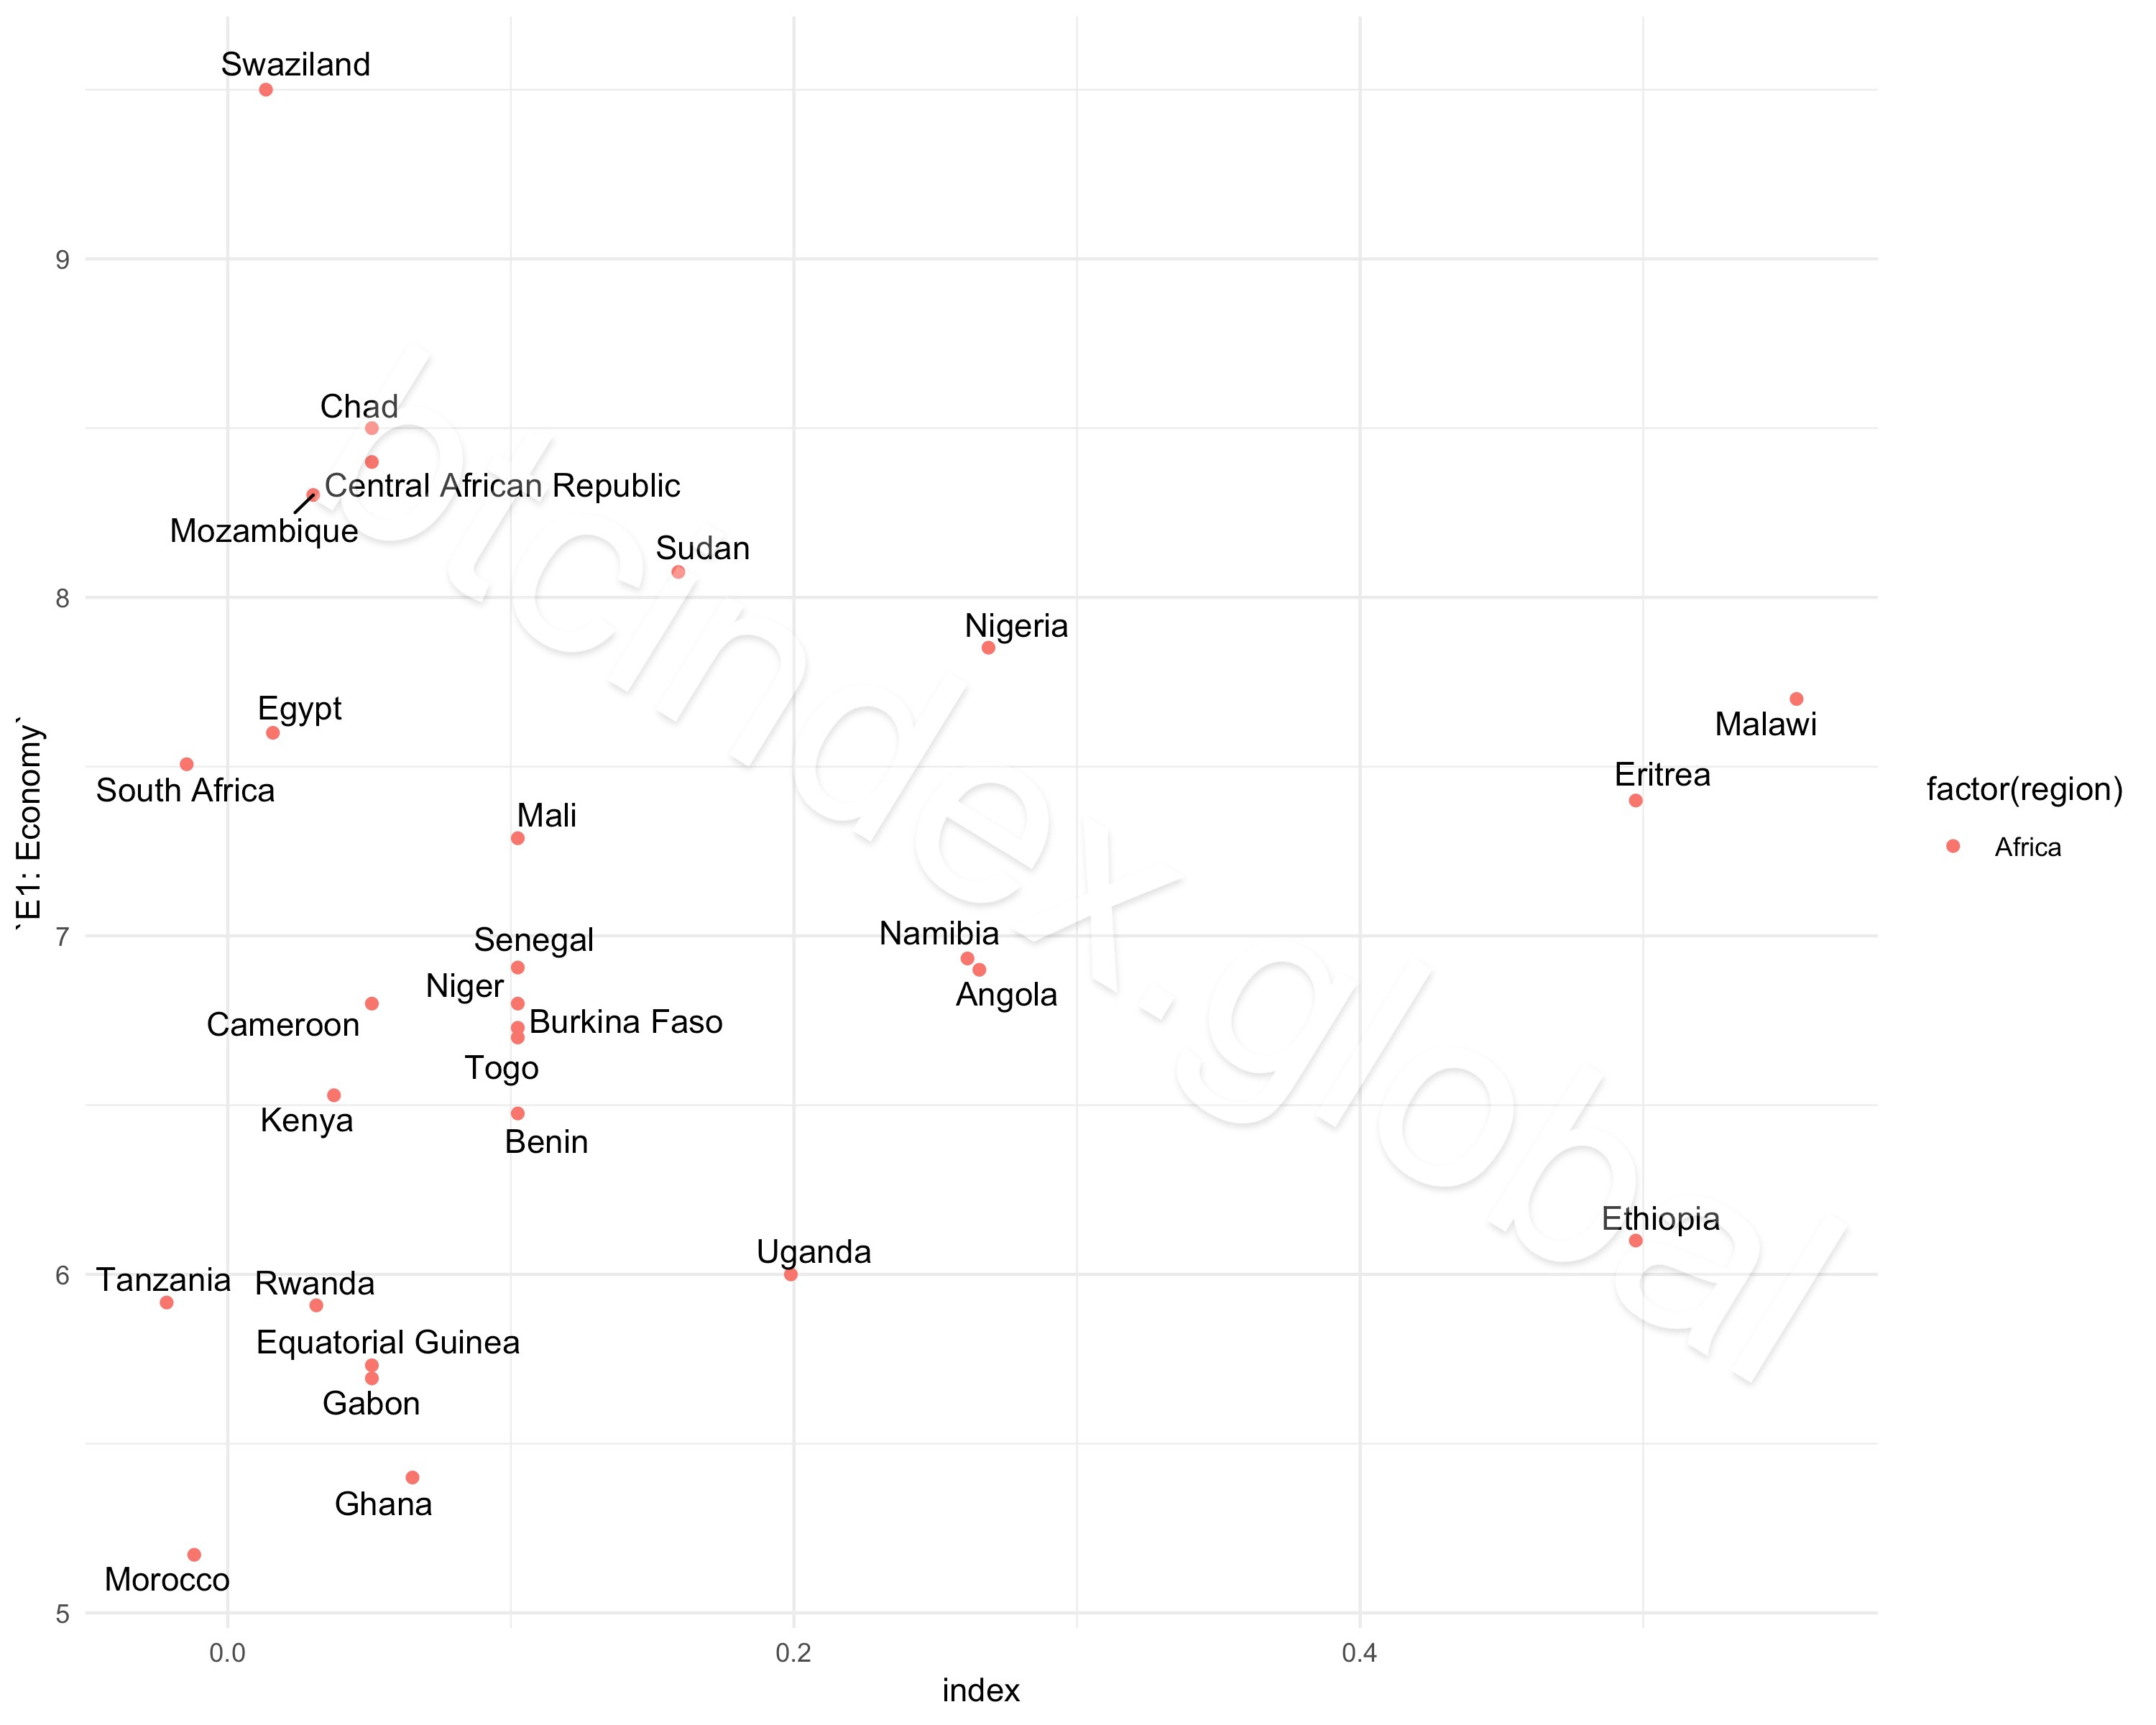
Africa
In Africa the correlation is weak with a lot of dispersion on the btc index numbers. There is a slight relationship between the two but countries such as Swaziland, Chad and Mozambique - all of which are high on the FSI E1 Economy metric - do not have similarly high btc index scores.
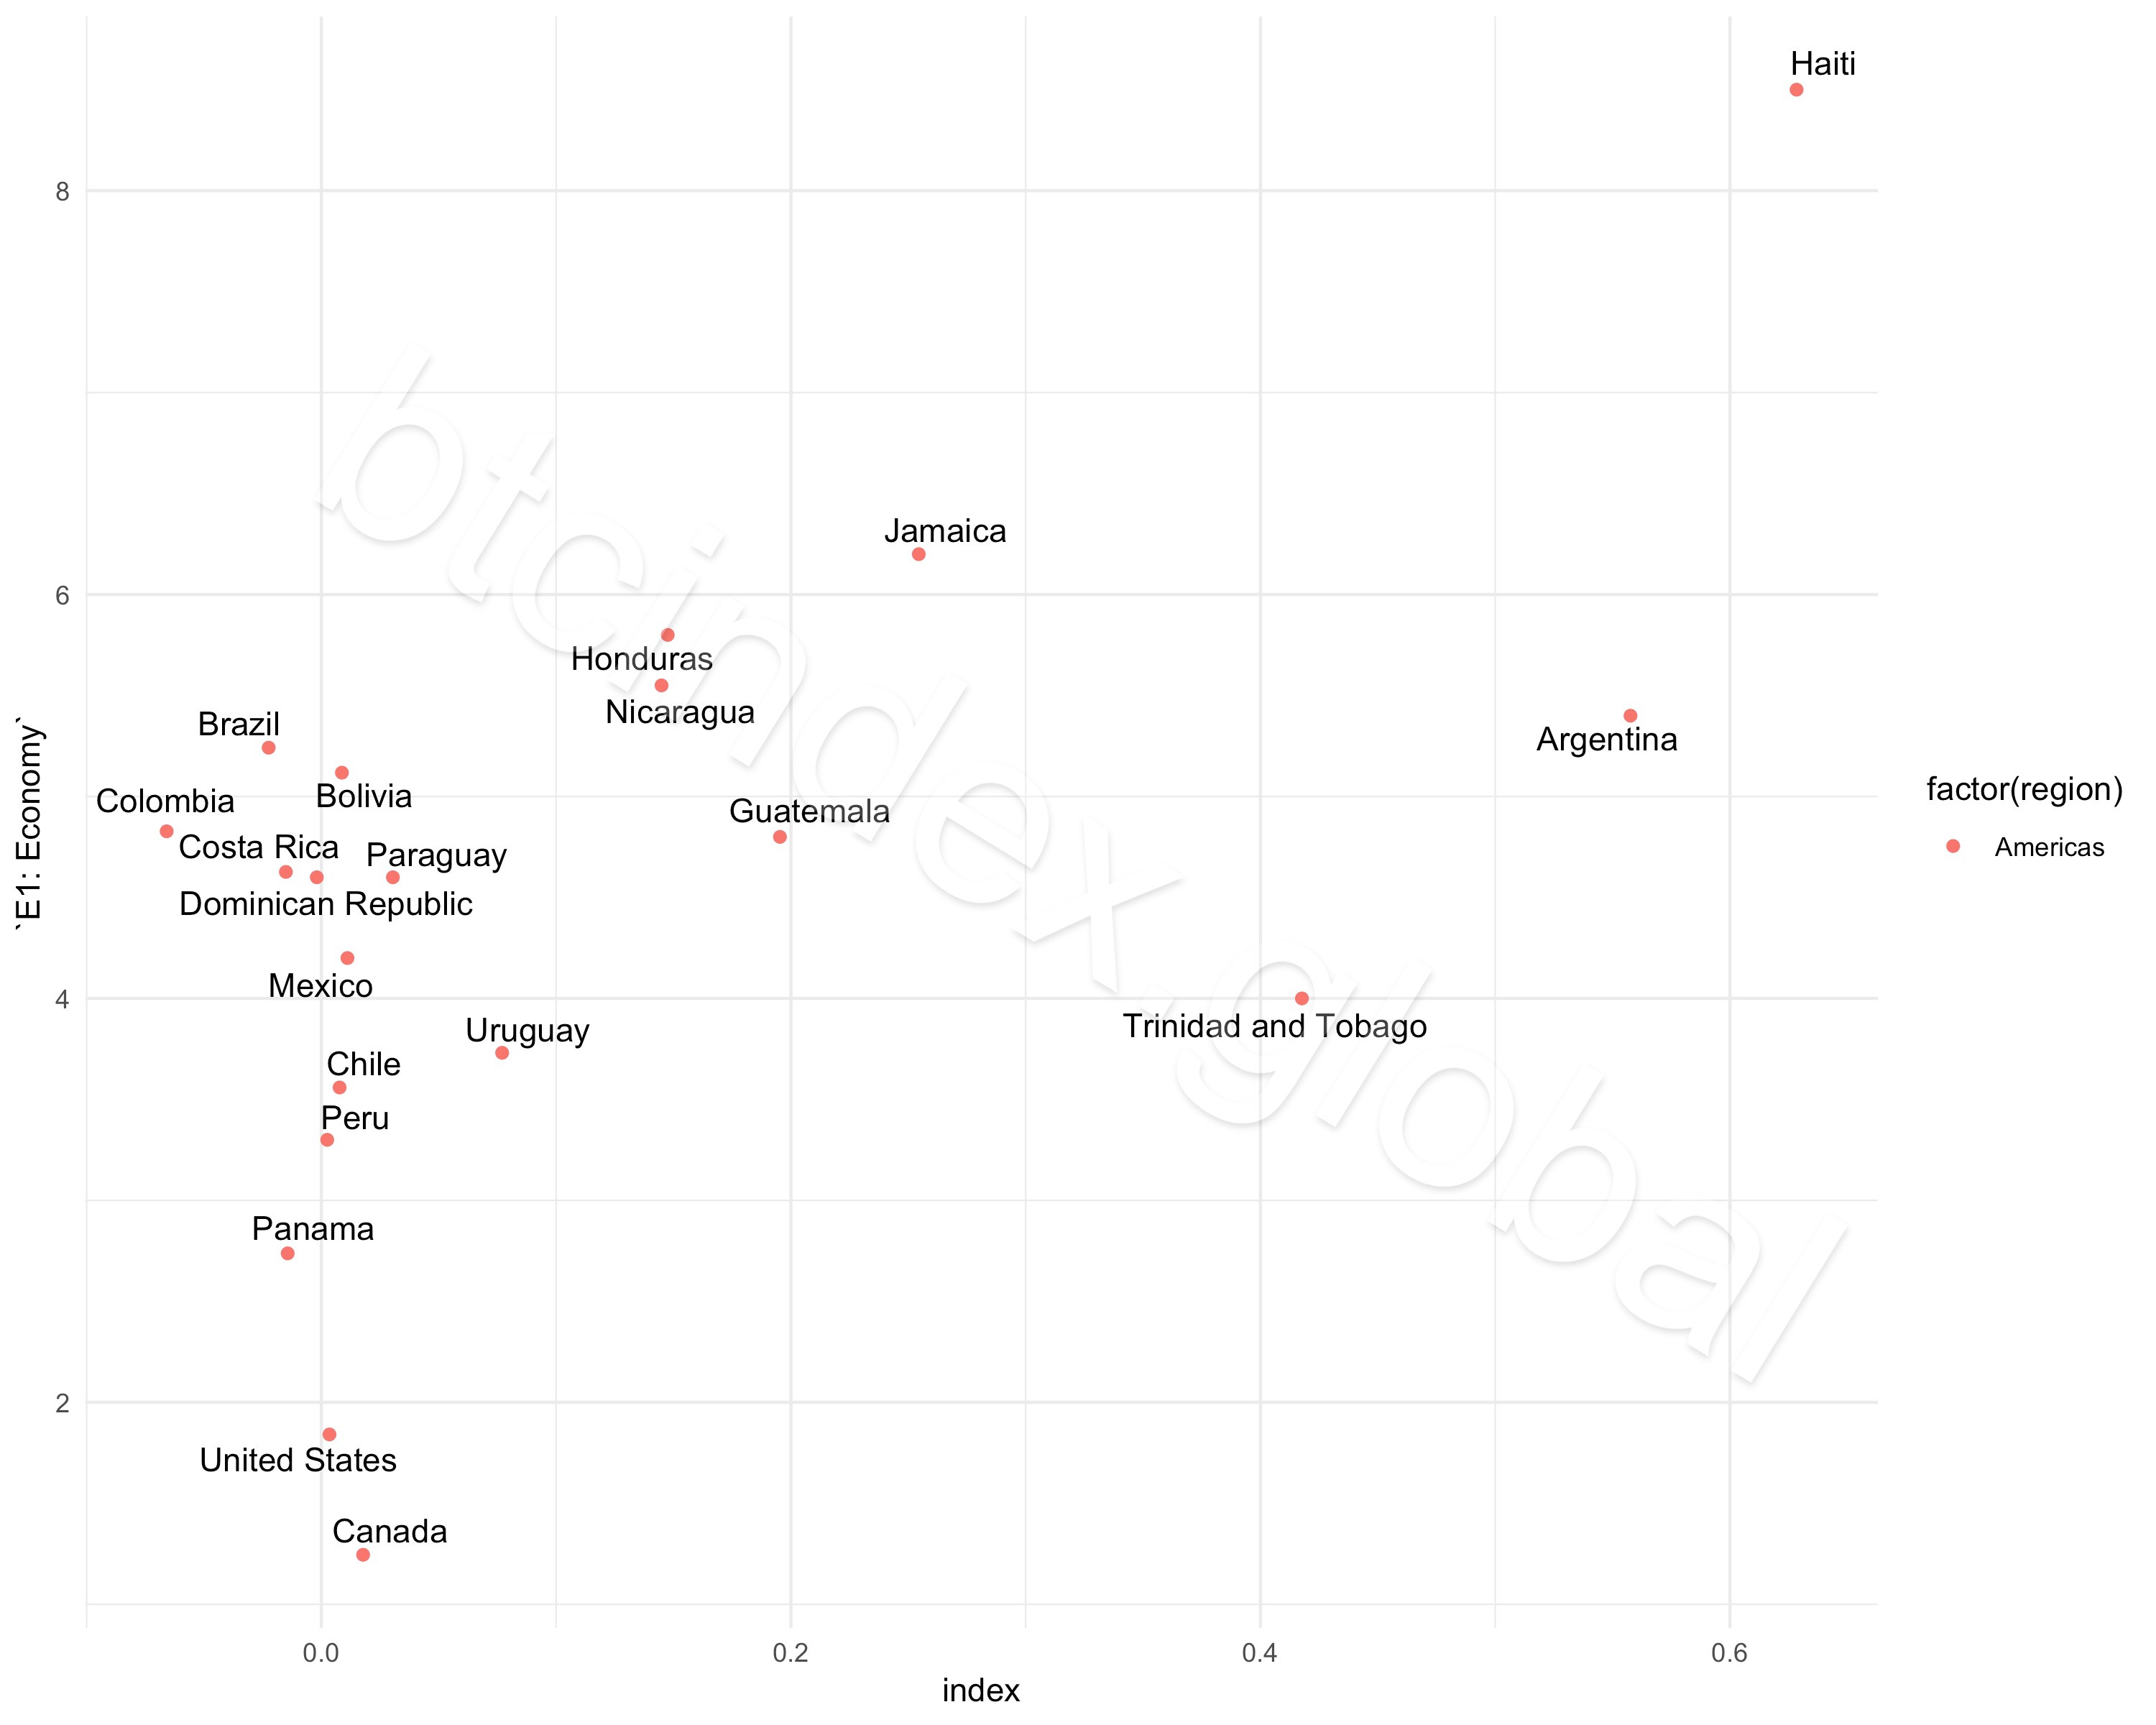
Americas
A more discernible relationship can be seen for countries in the Americas. Haiti is the obvious candidate for strongest relationship between the two at one end of the spectrum - which is mirrored by the USA and Canada at the other end of the spectrum.
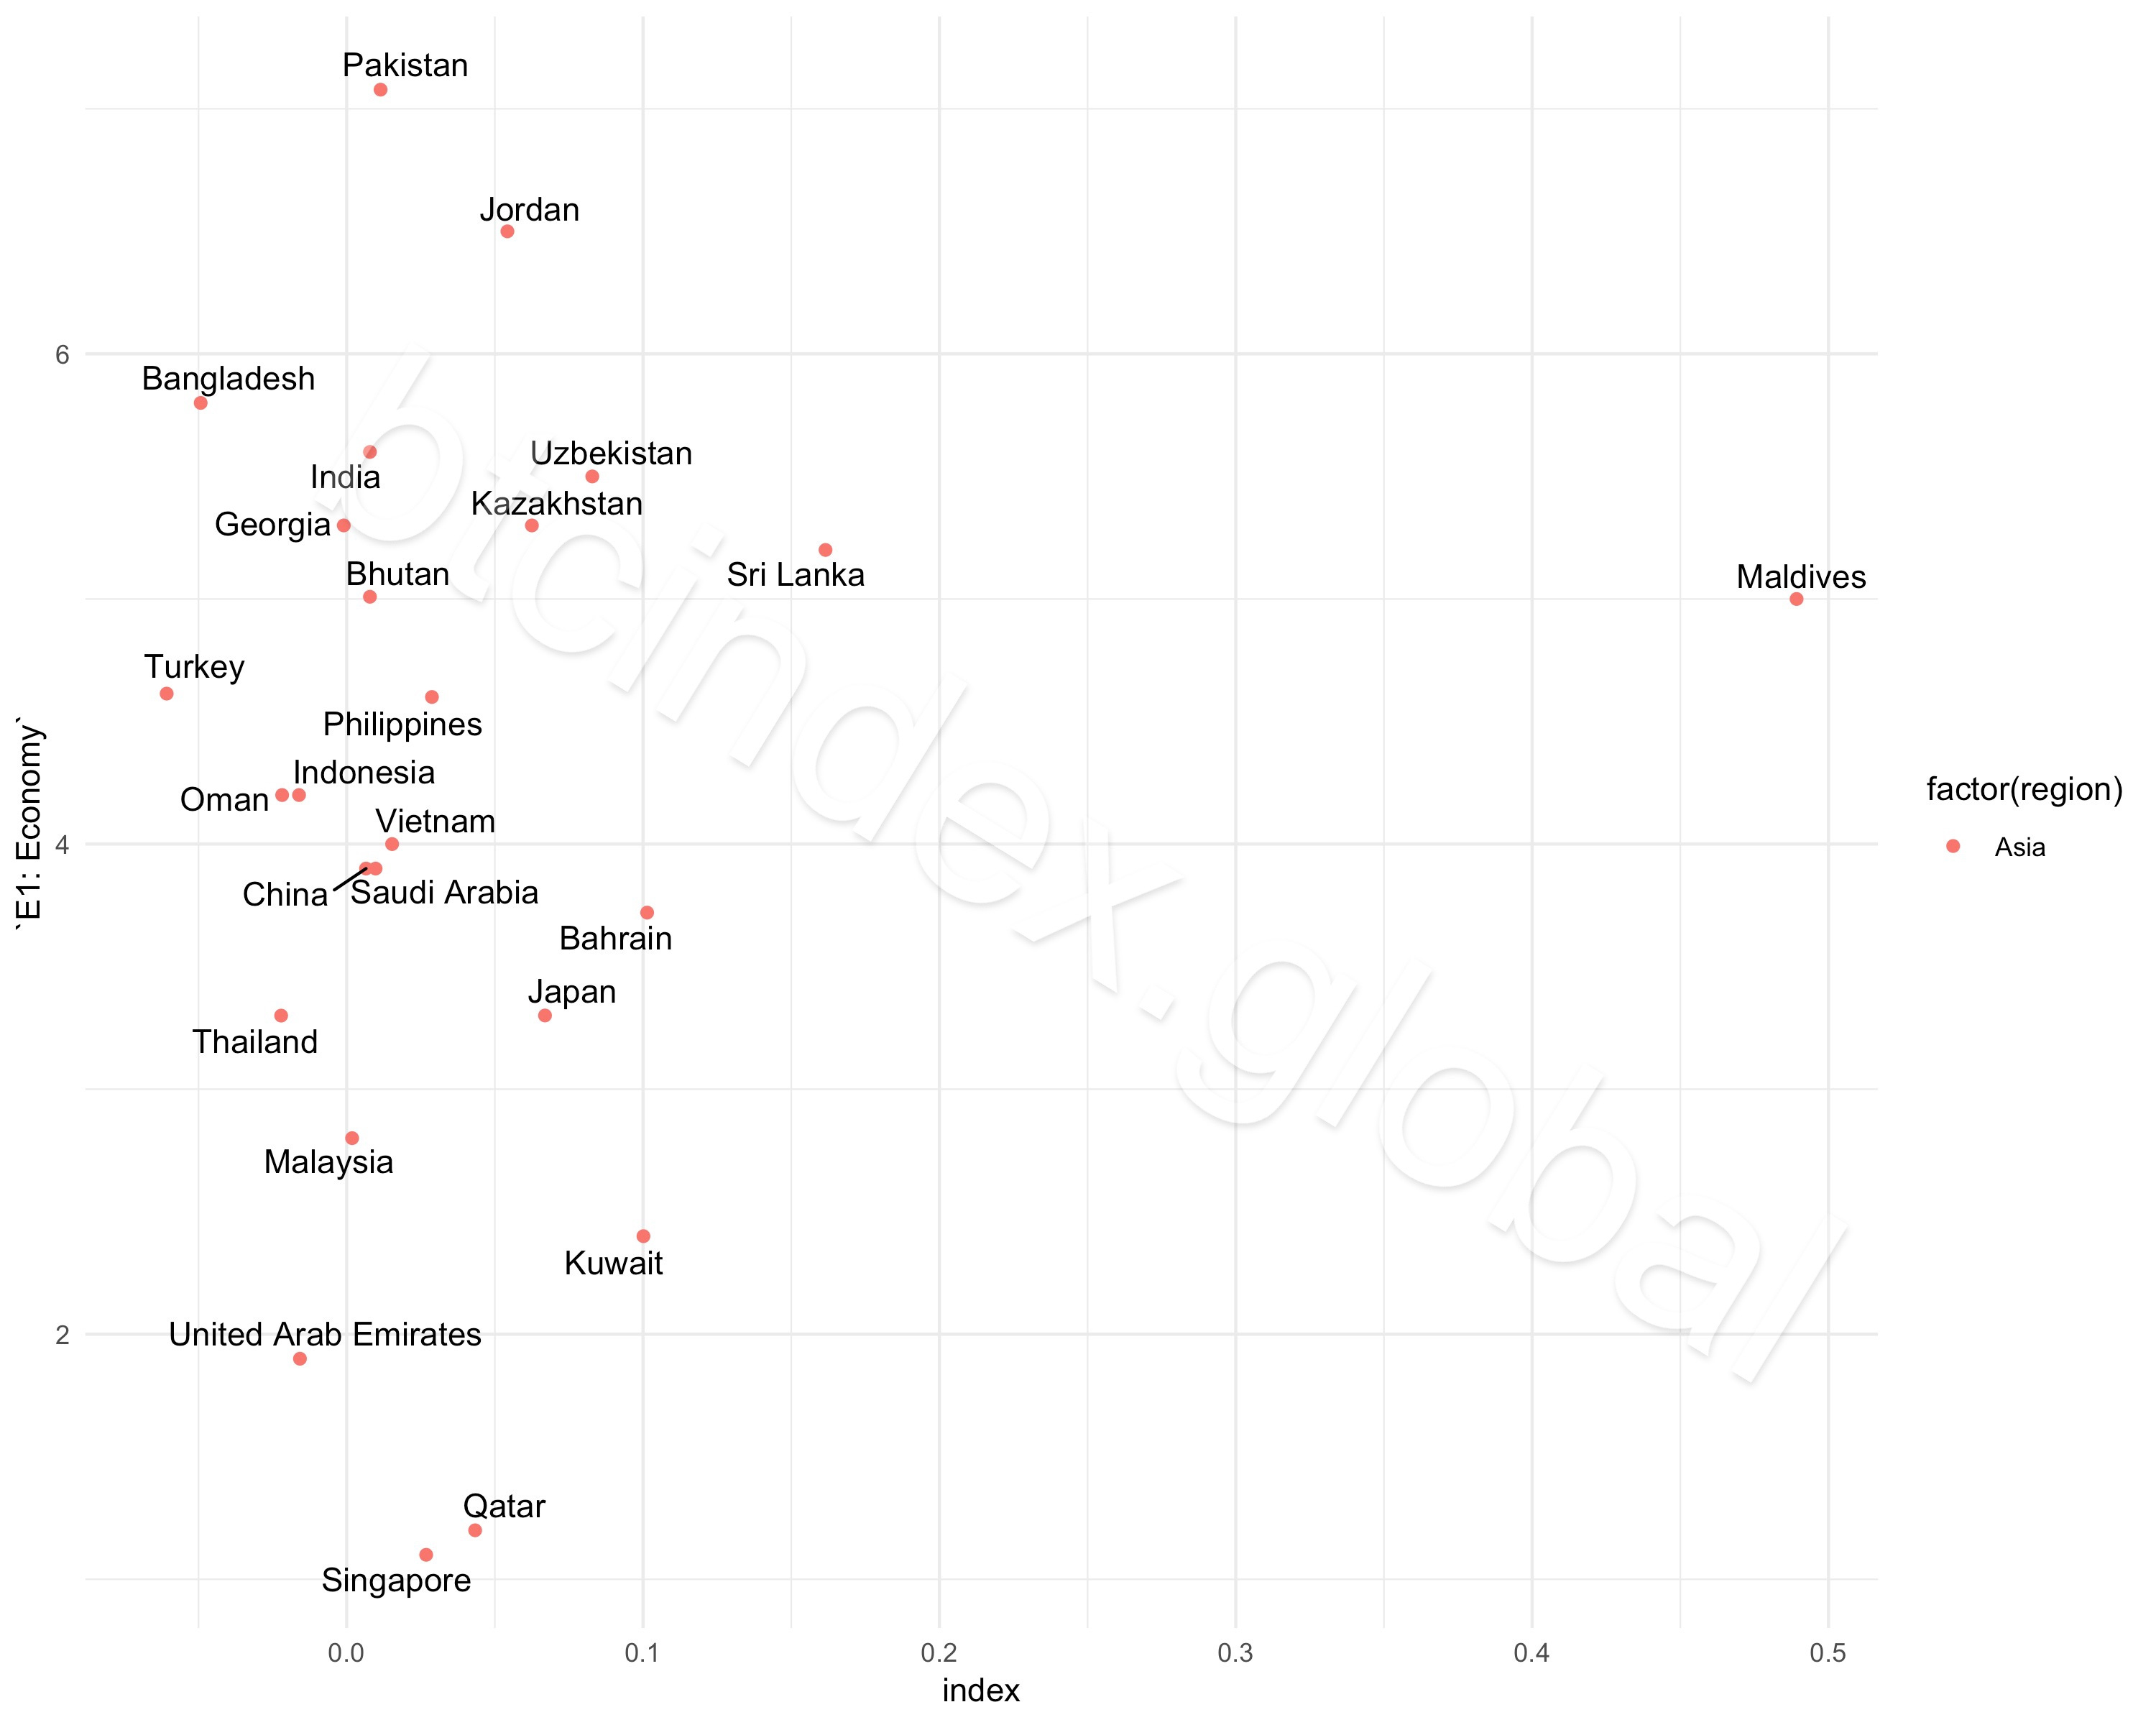
Asia
For the countries loosely grouped as ‘Asia’ the wide dispersion in FSI E1 Economy scores is not mirrored in the btc index scores. Even removing outlier the Maldives results in a chart with countries scattered across all four quadrants. Adding a regression line to the chart literally sees a line go horizontally from left to right.
To conclude, it should be noted that the 2020 Fragile States Index is being compared against the btc index from March 2021 - so they are not directly comparable. A better comparison might be made between the average of the btc index throughout 2020 against the 2020 Fragile States Index. Another comparison might compare changes in both measures over some time frame. There is also the issue of reconciling the scale of the Fragile States Index against the btc index - it could very well be that one or both need to be normalised so as to identify the relationship, if there is one. Finally, the Fragile States Index economic indicator is a composite of three other measures. Disaggregating them might be necessary as some sub-components might correlate more than others.
With all that in mind, hopefully posting this helps point others in a more promising future direction. Sometimes it helps to know where one blind alley lies. Any feedback or suggestions are welcome if anyone has an idea of where this piece of exploration could go.
Regional charts
Currencies/countries to look closely at this month include:
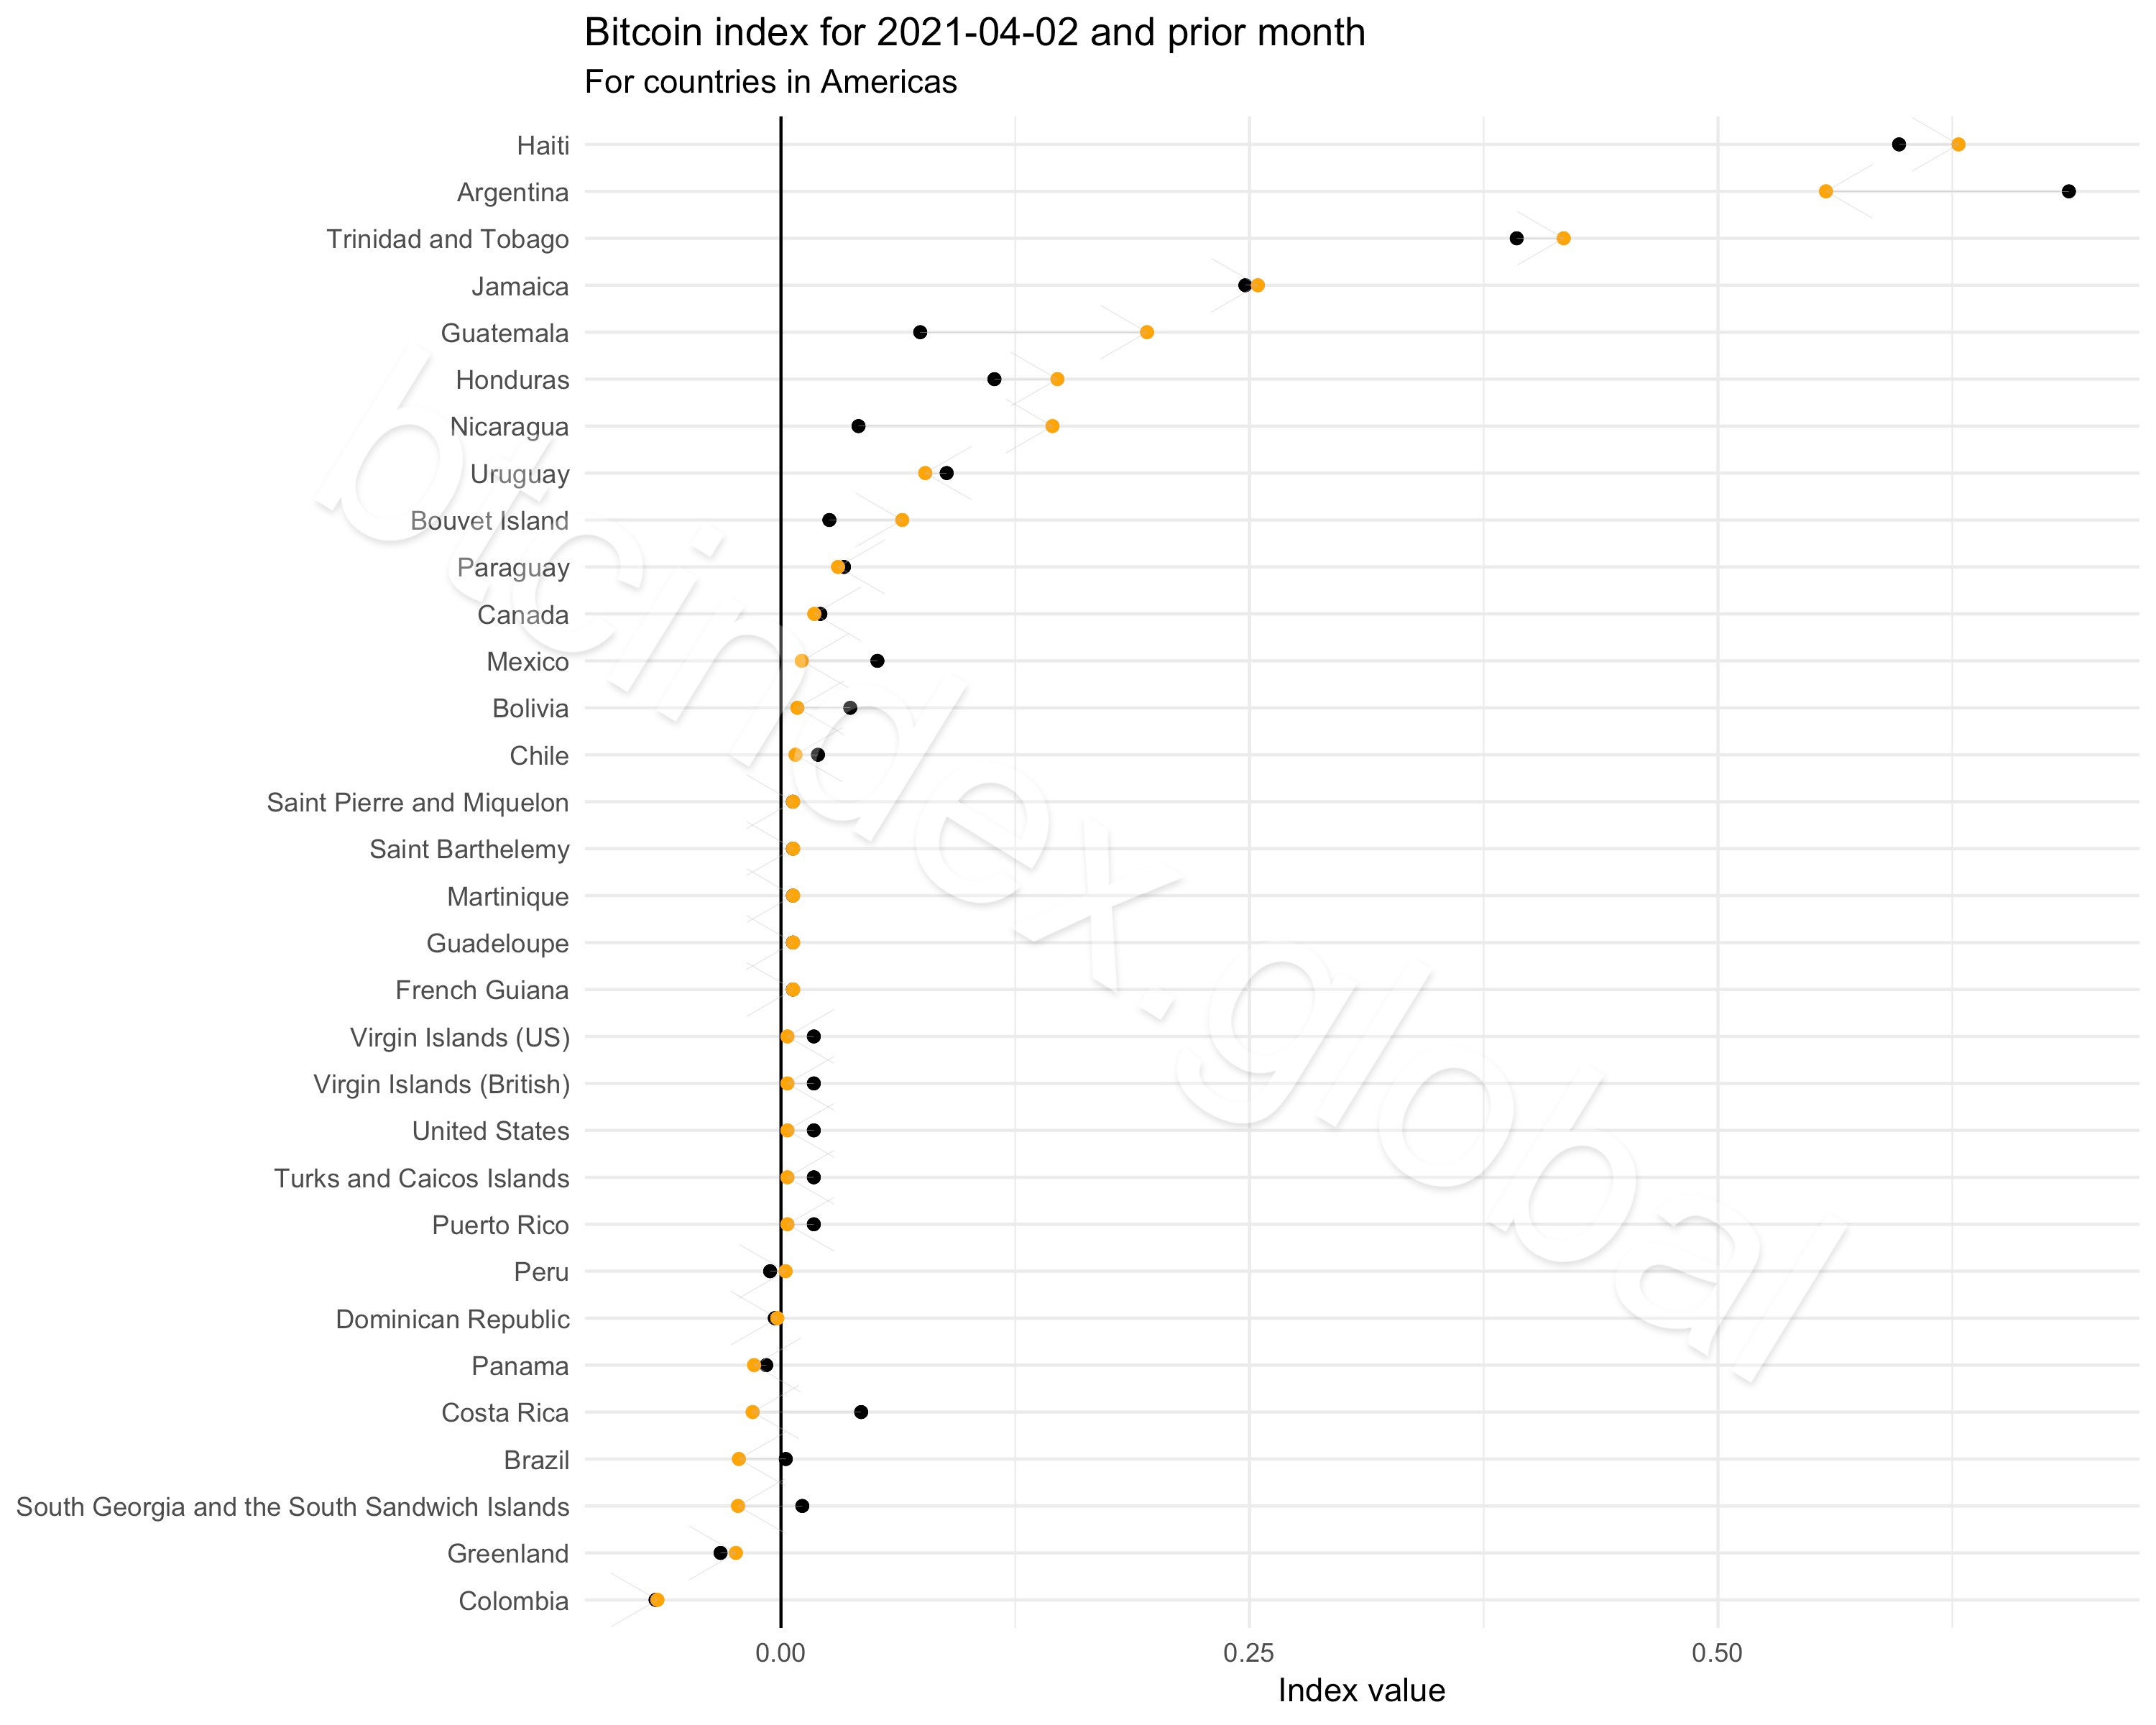
The premium at which bitcoins sell in Argentina has narrowed quite a bit.
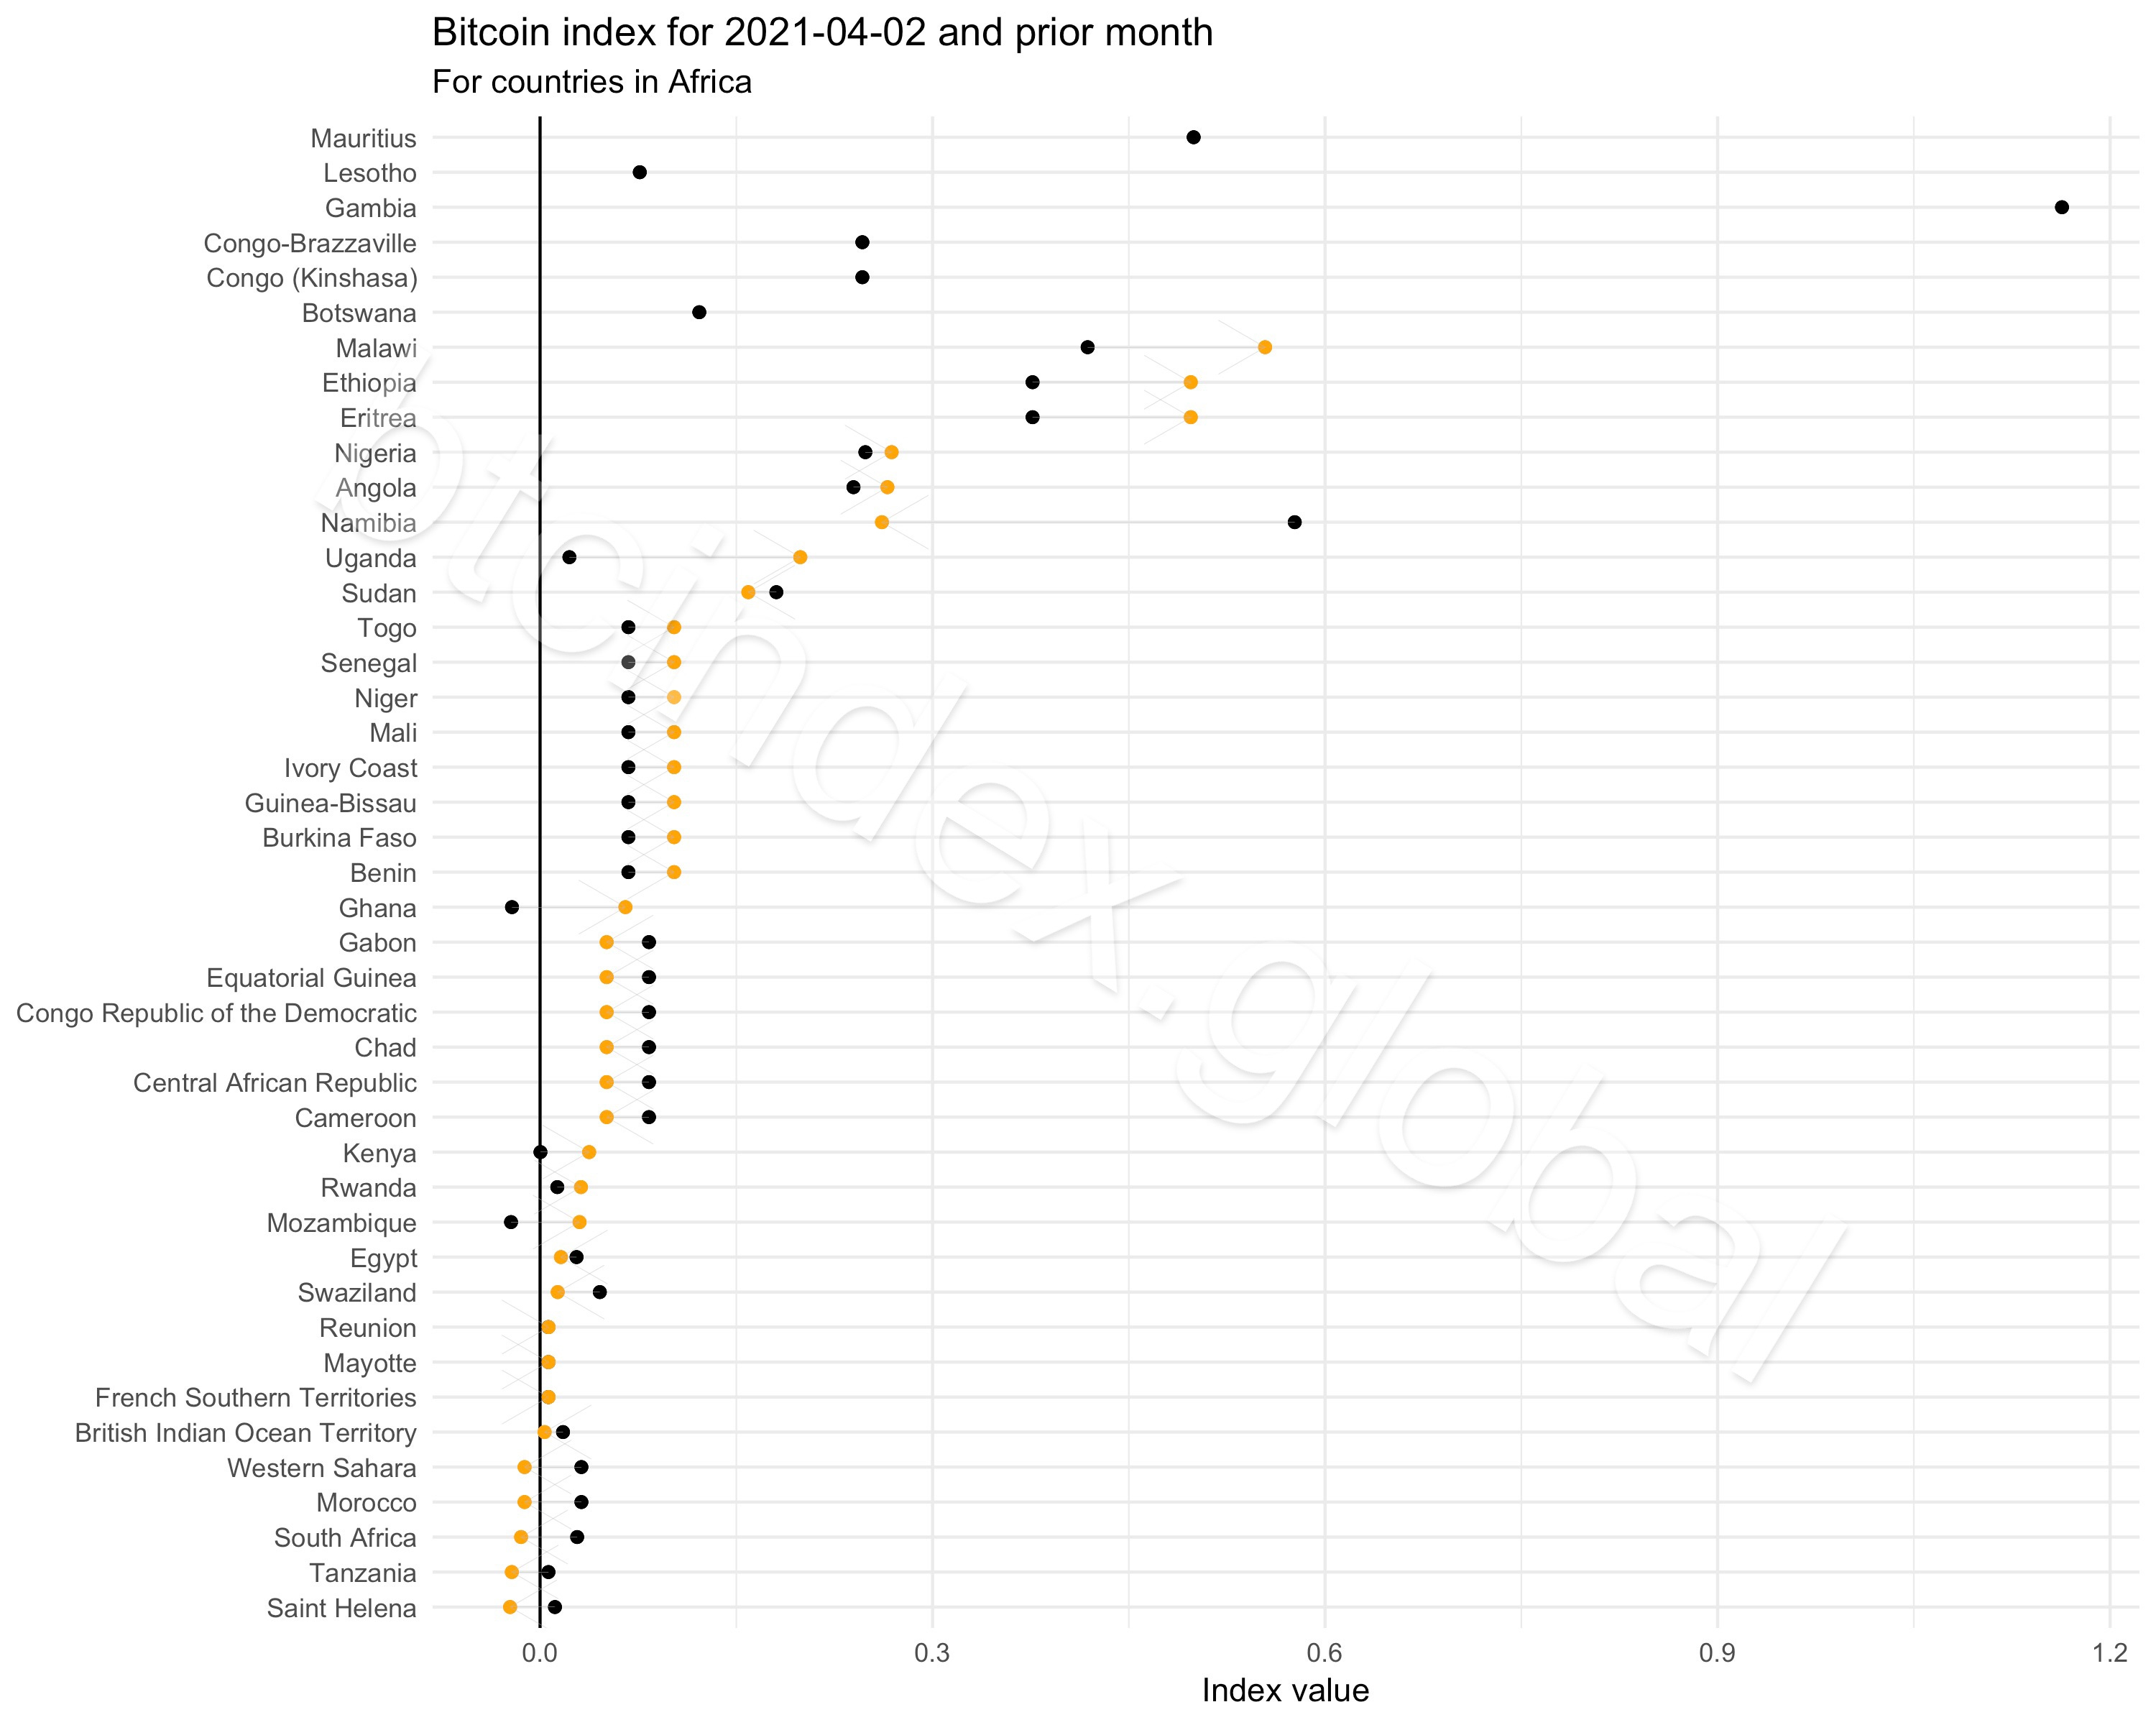
Similarly Namibia’s premium has shrunk substantially this month.
Colombia is still one of the countries in the world where bitcoins sell at the biggest discount.
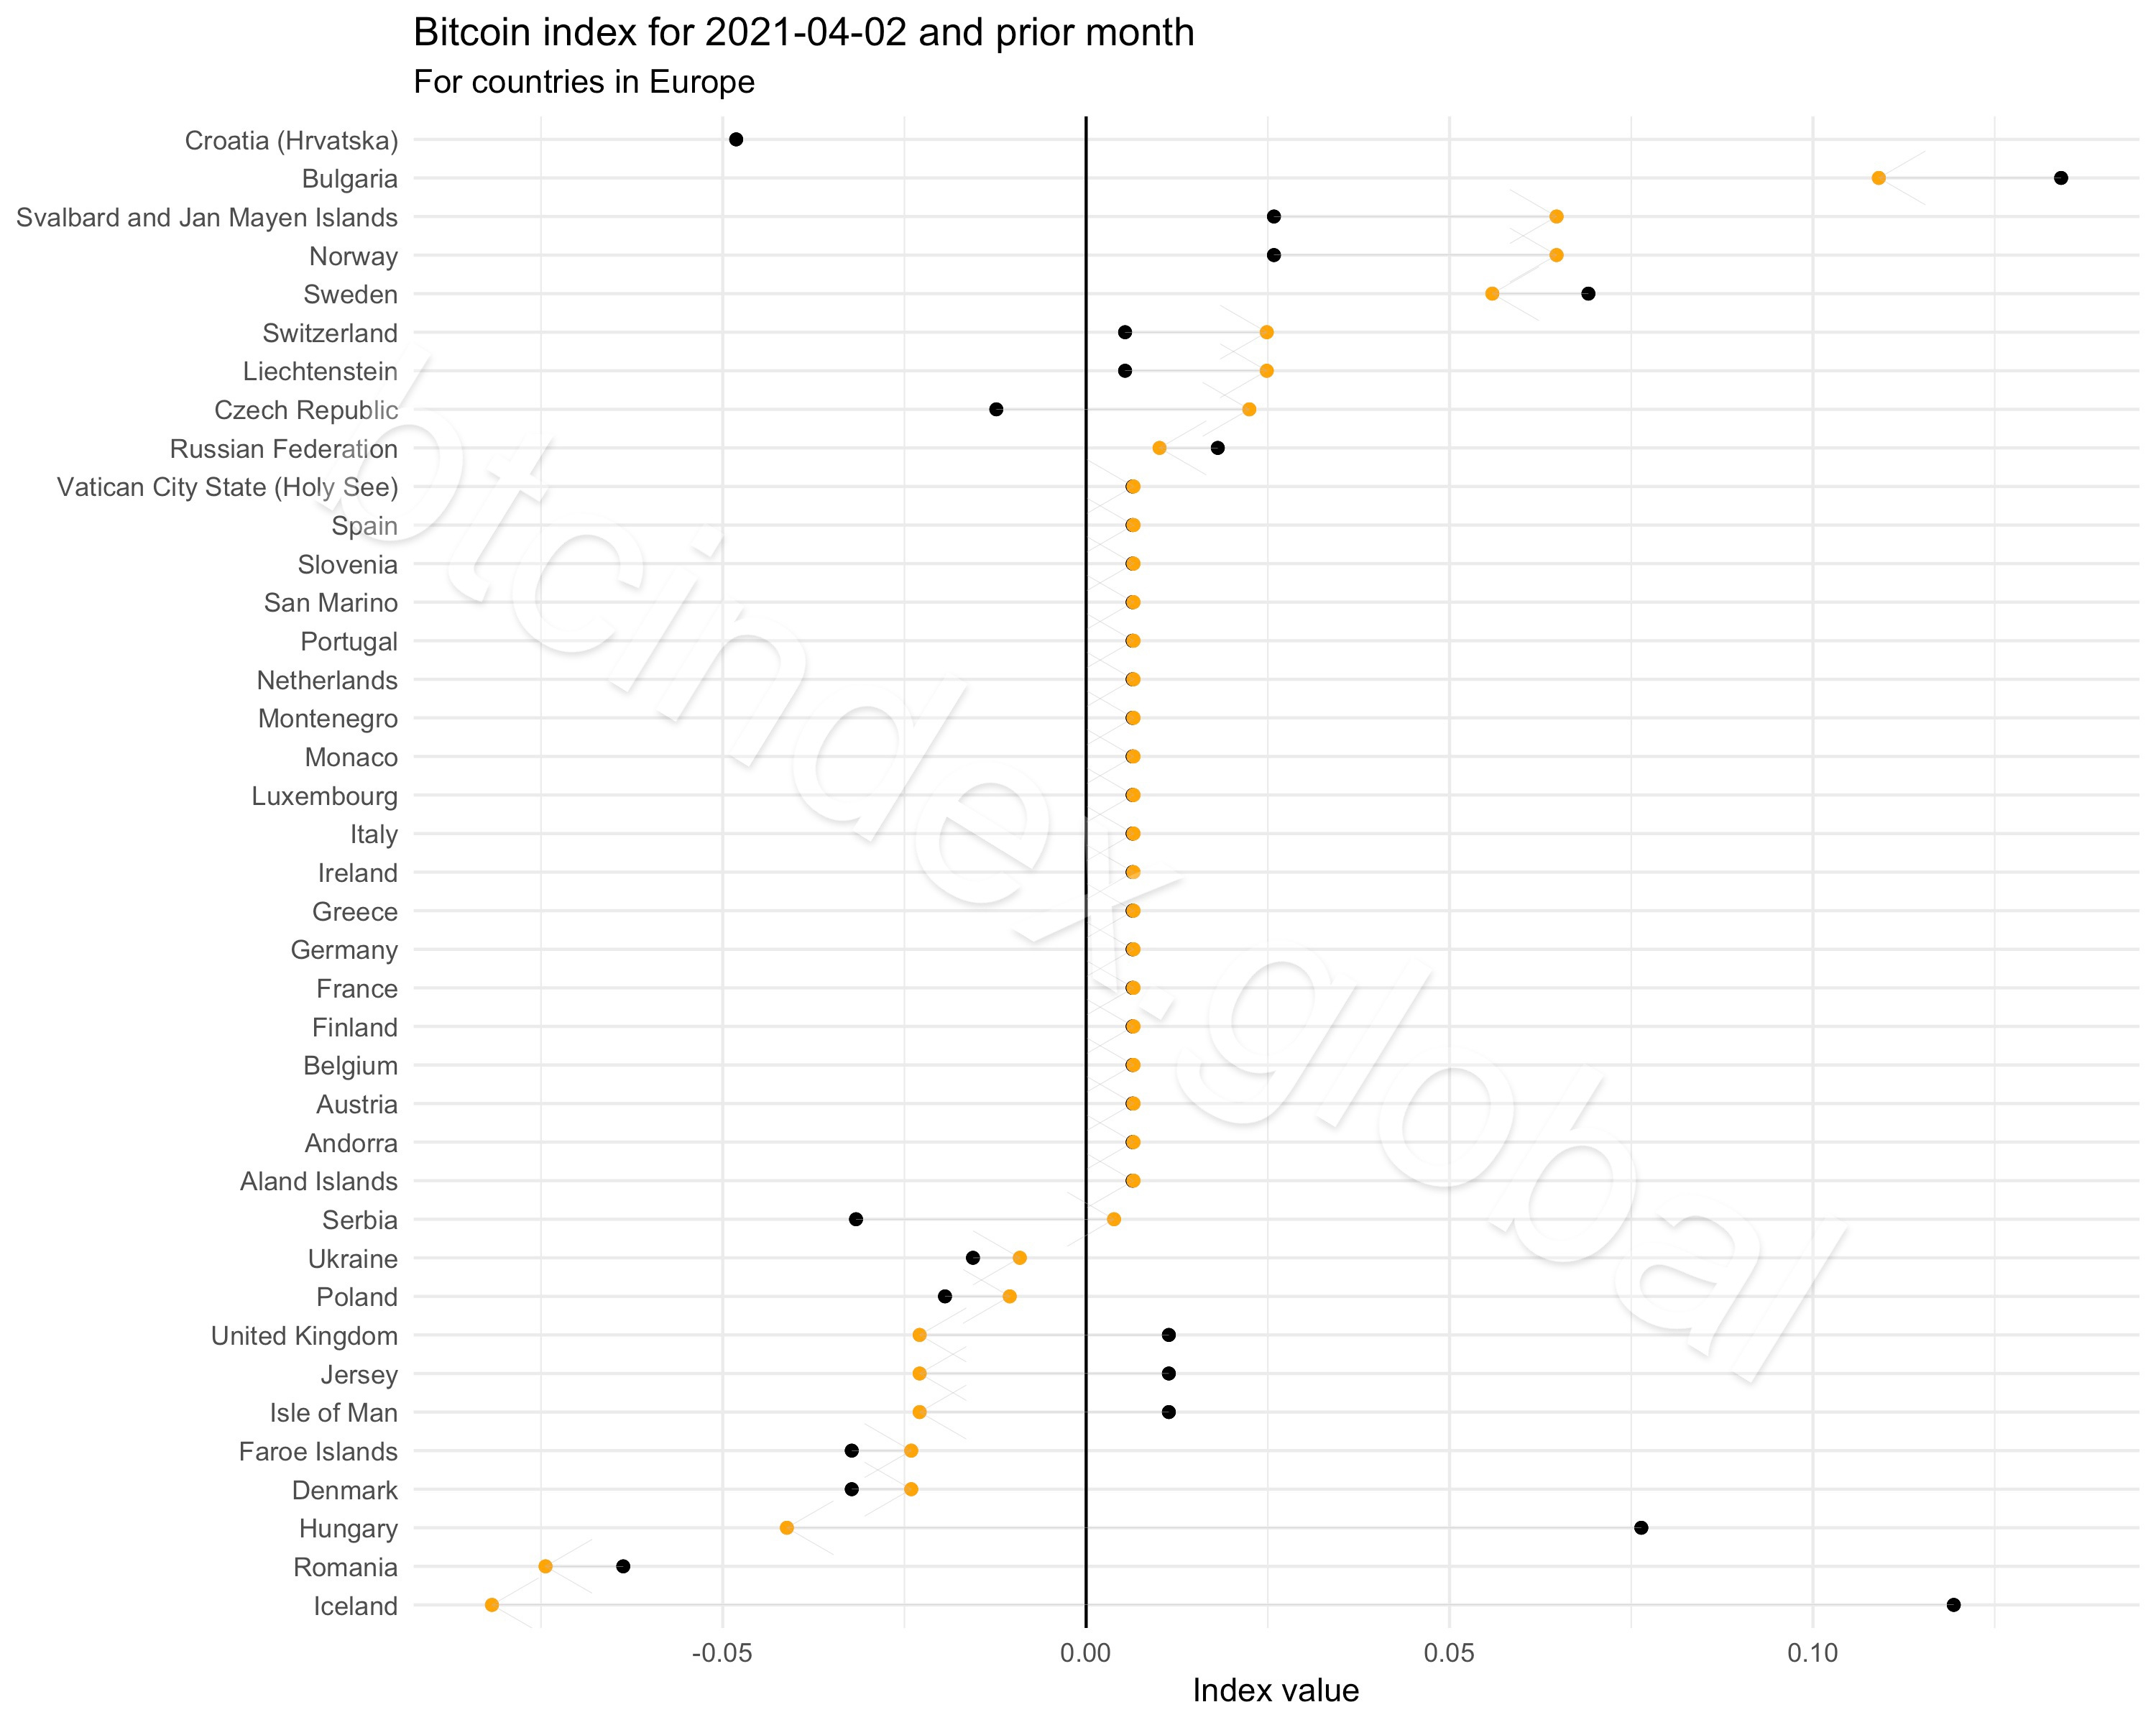
What little bitcoin activity occurs in Iceland has seen a premium last month swing to a slight discount this month.
In all countries loosely grouped as ‘Asia’ the biggest discounts this month are found in Turkey. The biggest premiums… still Lebanon.
Asia
Americas
Africa
Europe
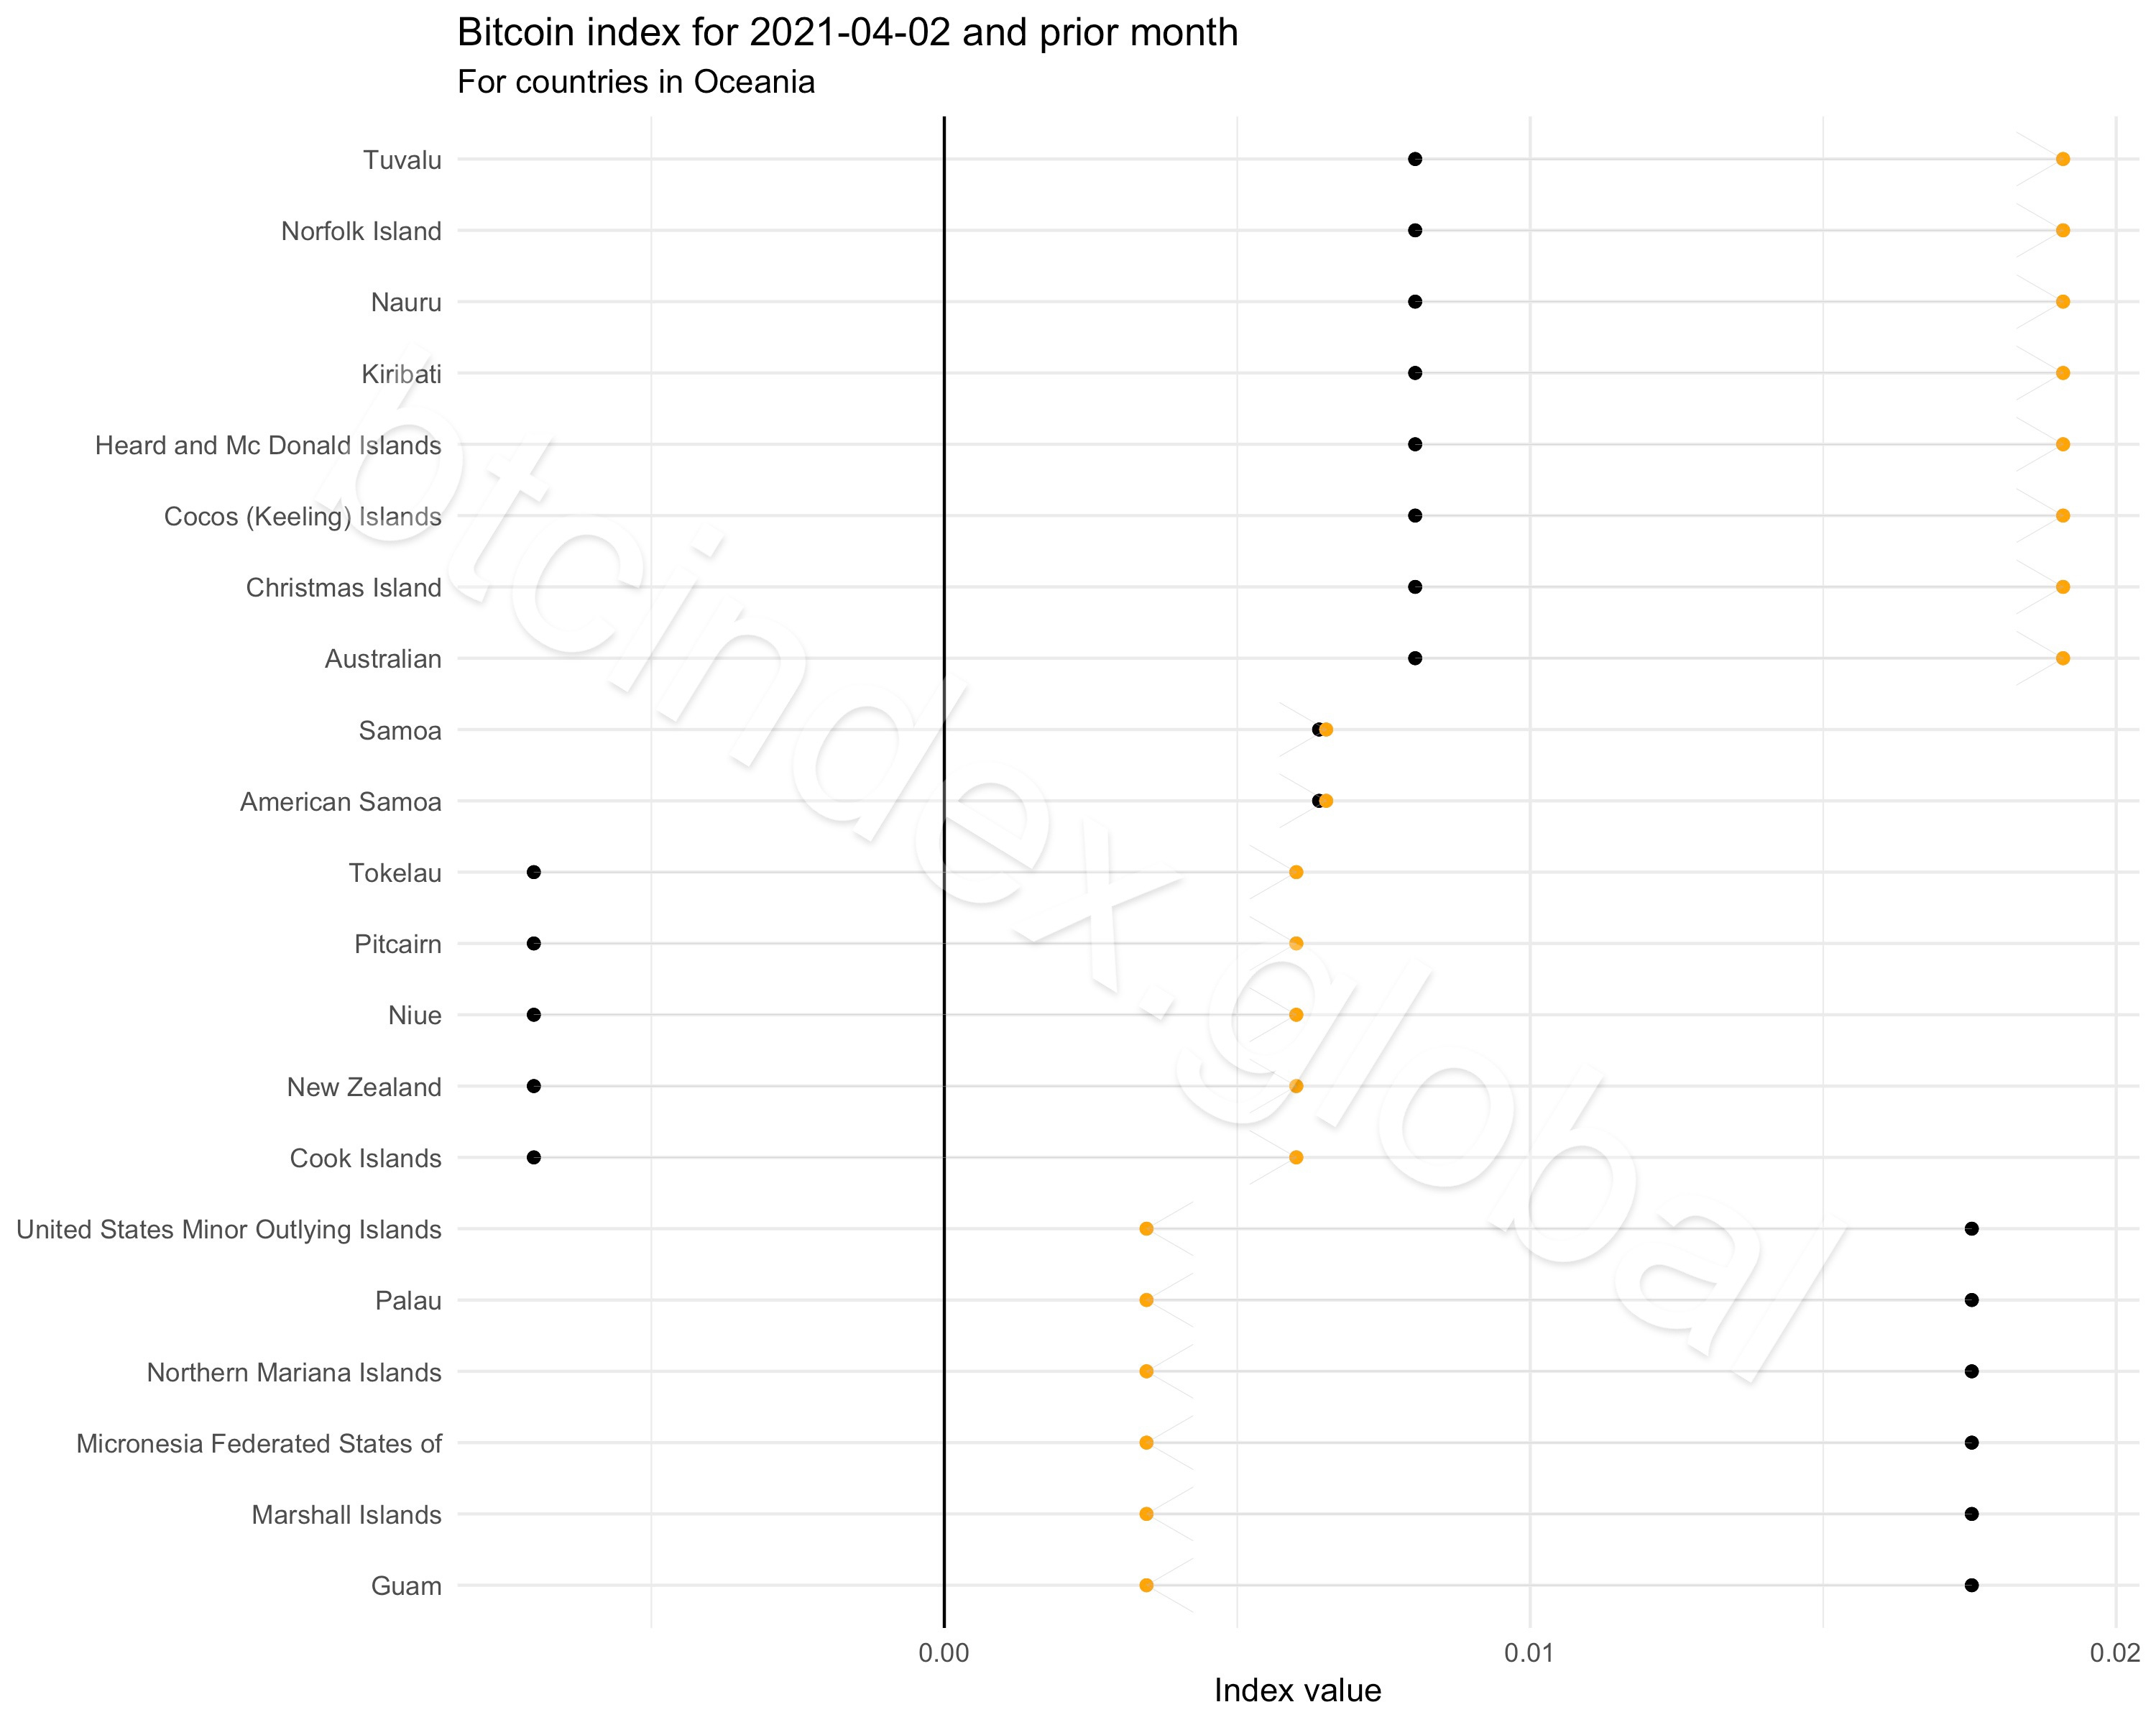
Oceania
Past months
Subscribe for auto-updates…
That’s it for this first monthly bulletin of the btc index. Each month a new bulletin will be posted with insights about why deviations and changes are seen across countries and currencies.