
BTC Index bulletin: Jan - Feb 2021
BTC Index bulletin: Jan - Feb 2021
With a spotlight on Lebanon...

This month’s Bitcoin Index bulletin mixes up the format a bit. After counting off the top 5 movers for the month it then puts the spotlight on one particular country: Lebanon. To finish things off it provides the regional charts one-by-one. Leave feedback on whether you think this works or not.
Top 5 movers for the month
Venezuela (+3,491)
Lebanon (-0.79)
Oman (-0.41)
Namibia (+0.32)
Czech Republic (-0.23)
Spotlight: Lebanon
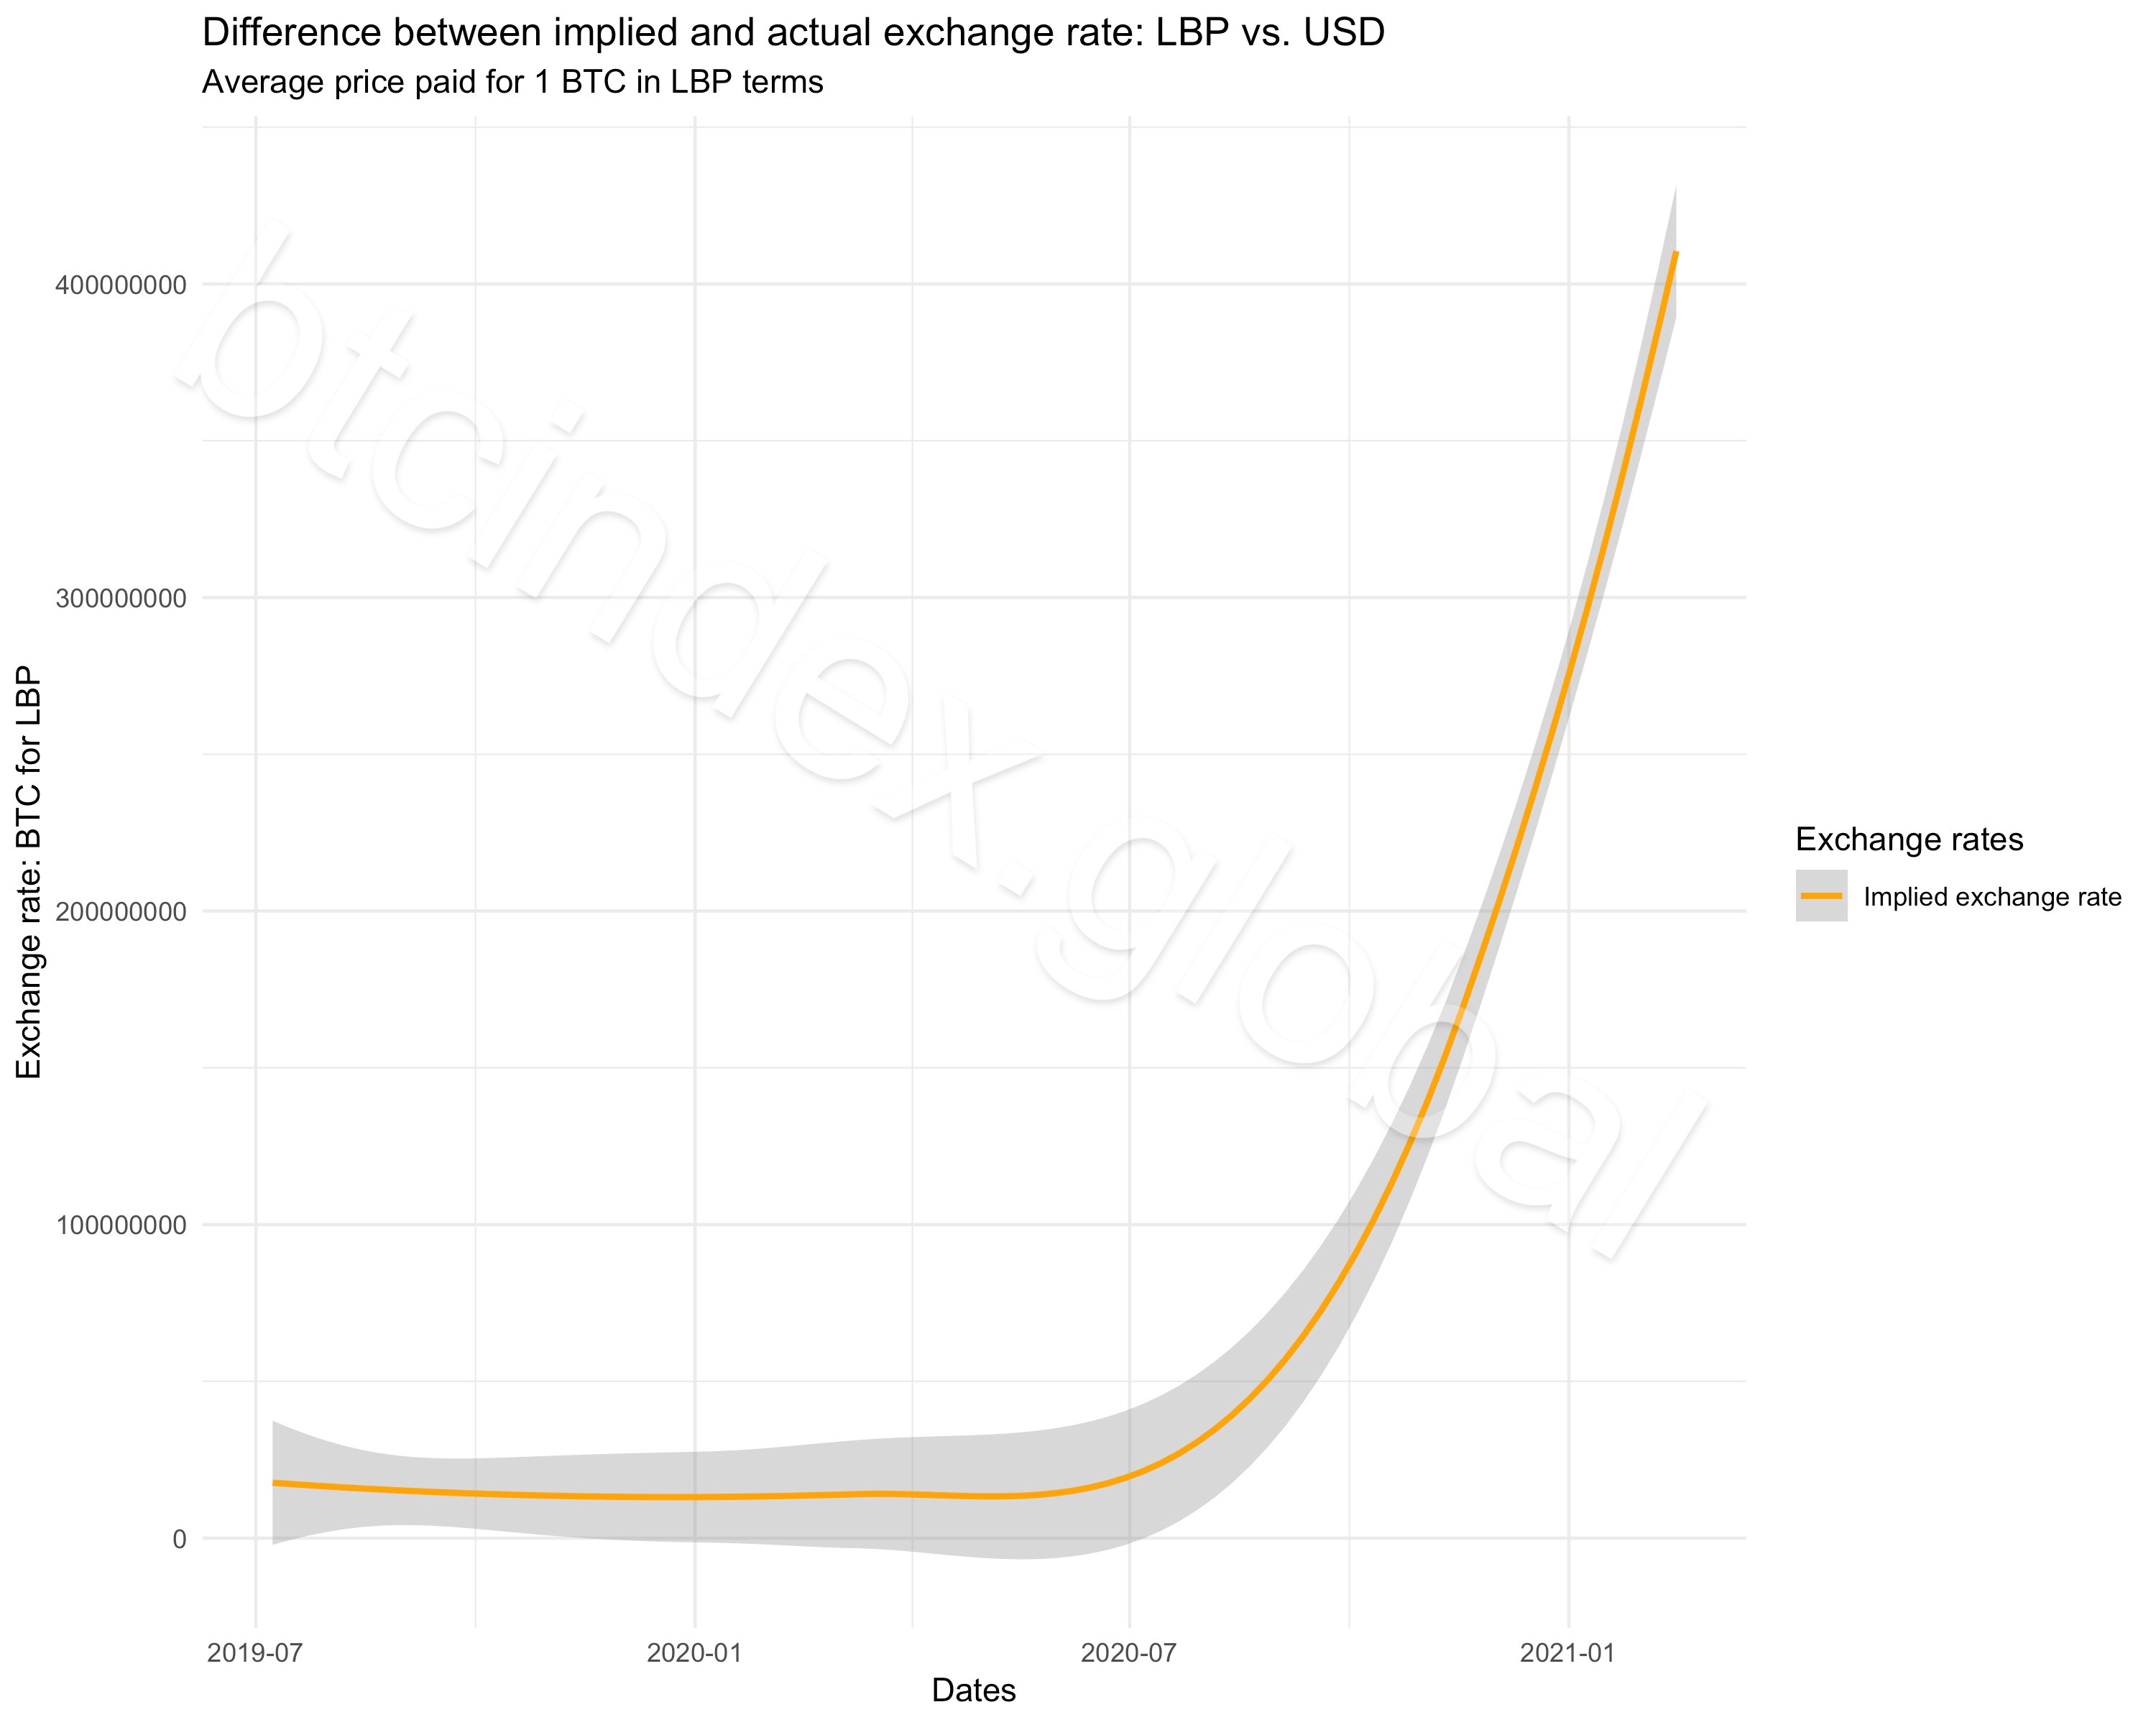
It is not secret that 2020 was a bad year macro-economically for Lebanon. Not much has changed unfortunately - with new protests occurring this week - the reasons for which the most recent Bitcoin Index demonstrates. [1 BTC currently sells for around 443 million LBP on average.] In percentage terms, the month-on-month difference in the implied exchange rate of Lebanese Pounds (LBP) to USD remained around 600% between mid-January and mid-February 2021. Aside from this real time insight into what is happening to the LBP, there are also a few interesting things that the Bitcoin Index can tell us though which were perhaps not obvious throughout the past year.

The first has to do with the timing of the currency devaluation. The Lebanese Pound has been pegged to around 1500 per USD since 1997. As a result, deterioration in its official exchange rate is hidden. In around January 2020, when the Lebanese government defaulted on its external debt, the Btc Index picked up on divergence in the LBP. That divergence continued to increase over the course of the year. Knowing that this divergence was occurring would have been very helpful for those who were holding LBP, particularly in the earliest stages of the devaluation.
The second interesting thing has to do with the trajectory that the implied exchange rate (i.e. the rate at which bitcoins are bought/sold for LBP in USD terms) took over 2020. That line goes up at a 45 degree angle… it does not have much deviation (i.e. variance) either as it progresses along its upward trajectory. This is a classic illustration of what high inflation or heavy devaluation look like in the Bitcoin Index. Last month this same trend was seen with the Nigerian Naira. It can also be seen clearly for the Venezuelan Bolivar Fuerte, the Iranian Rial, and to a lesser extent the Argentinian Peso. While at the present moment none of these trends are surprising in the future there is a high chance that the Bitcoin Index will spot similar trends before they hit the mainstream press.
[Addition 3/3/21] A request was made for the price at which 1 BTC is exchanged, on average, in LBP terms over the past month. The answer is approximately 433 million LBP per 1 BTC (historical chart below).
Regional charts
Currencies/countries to look closely at this month include:
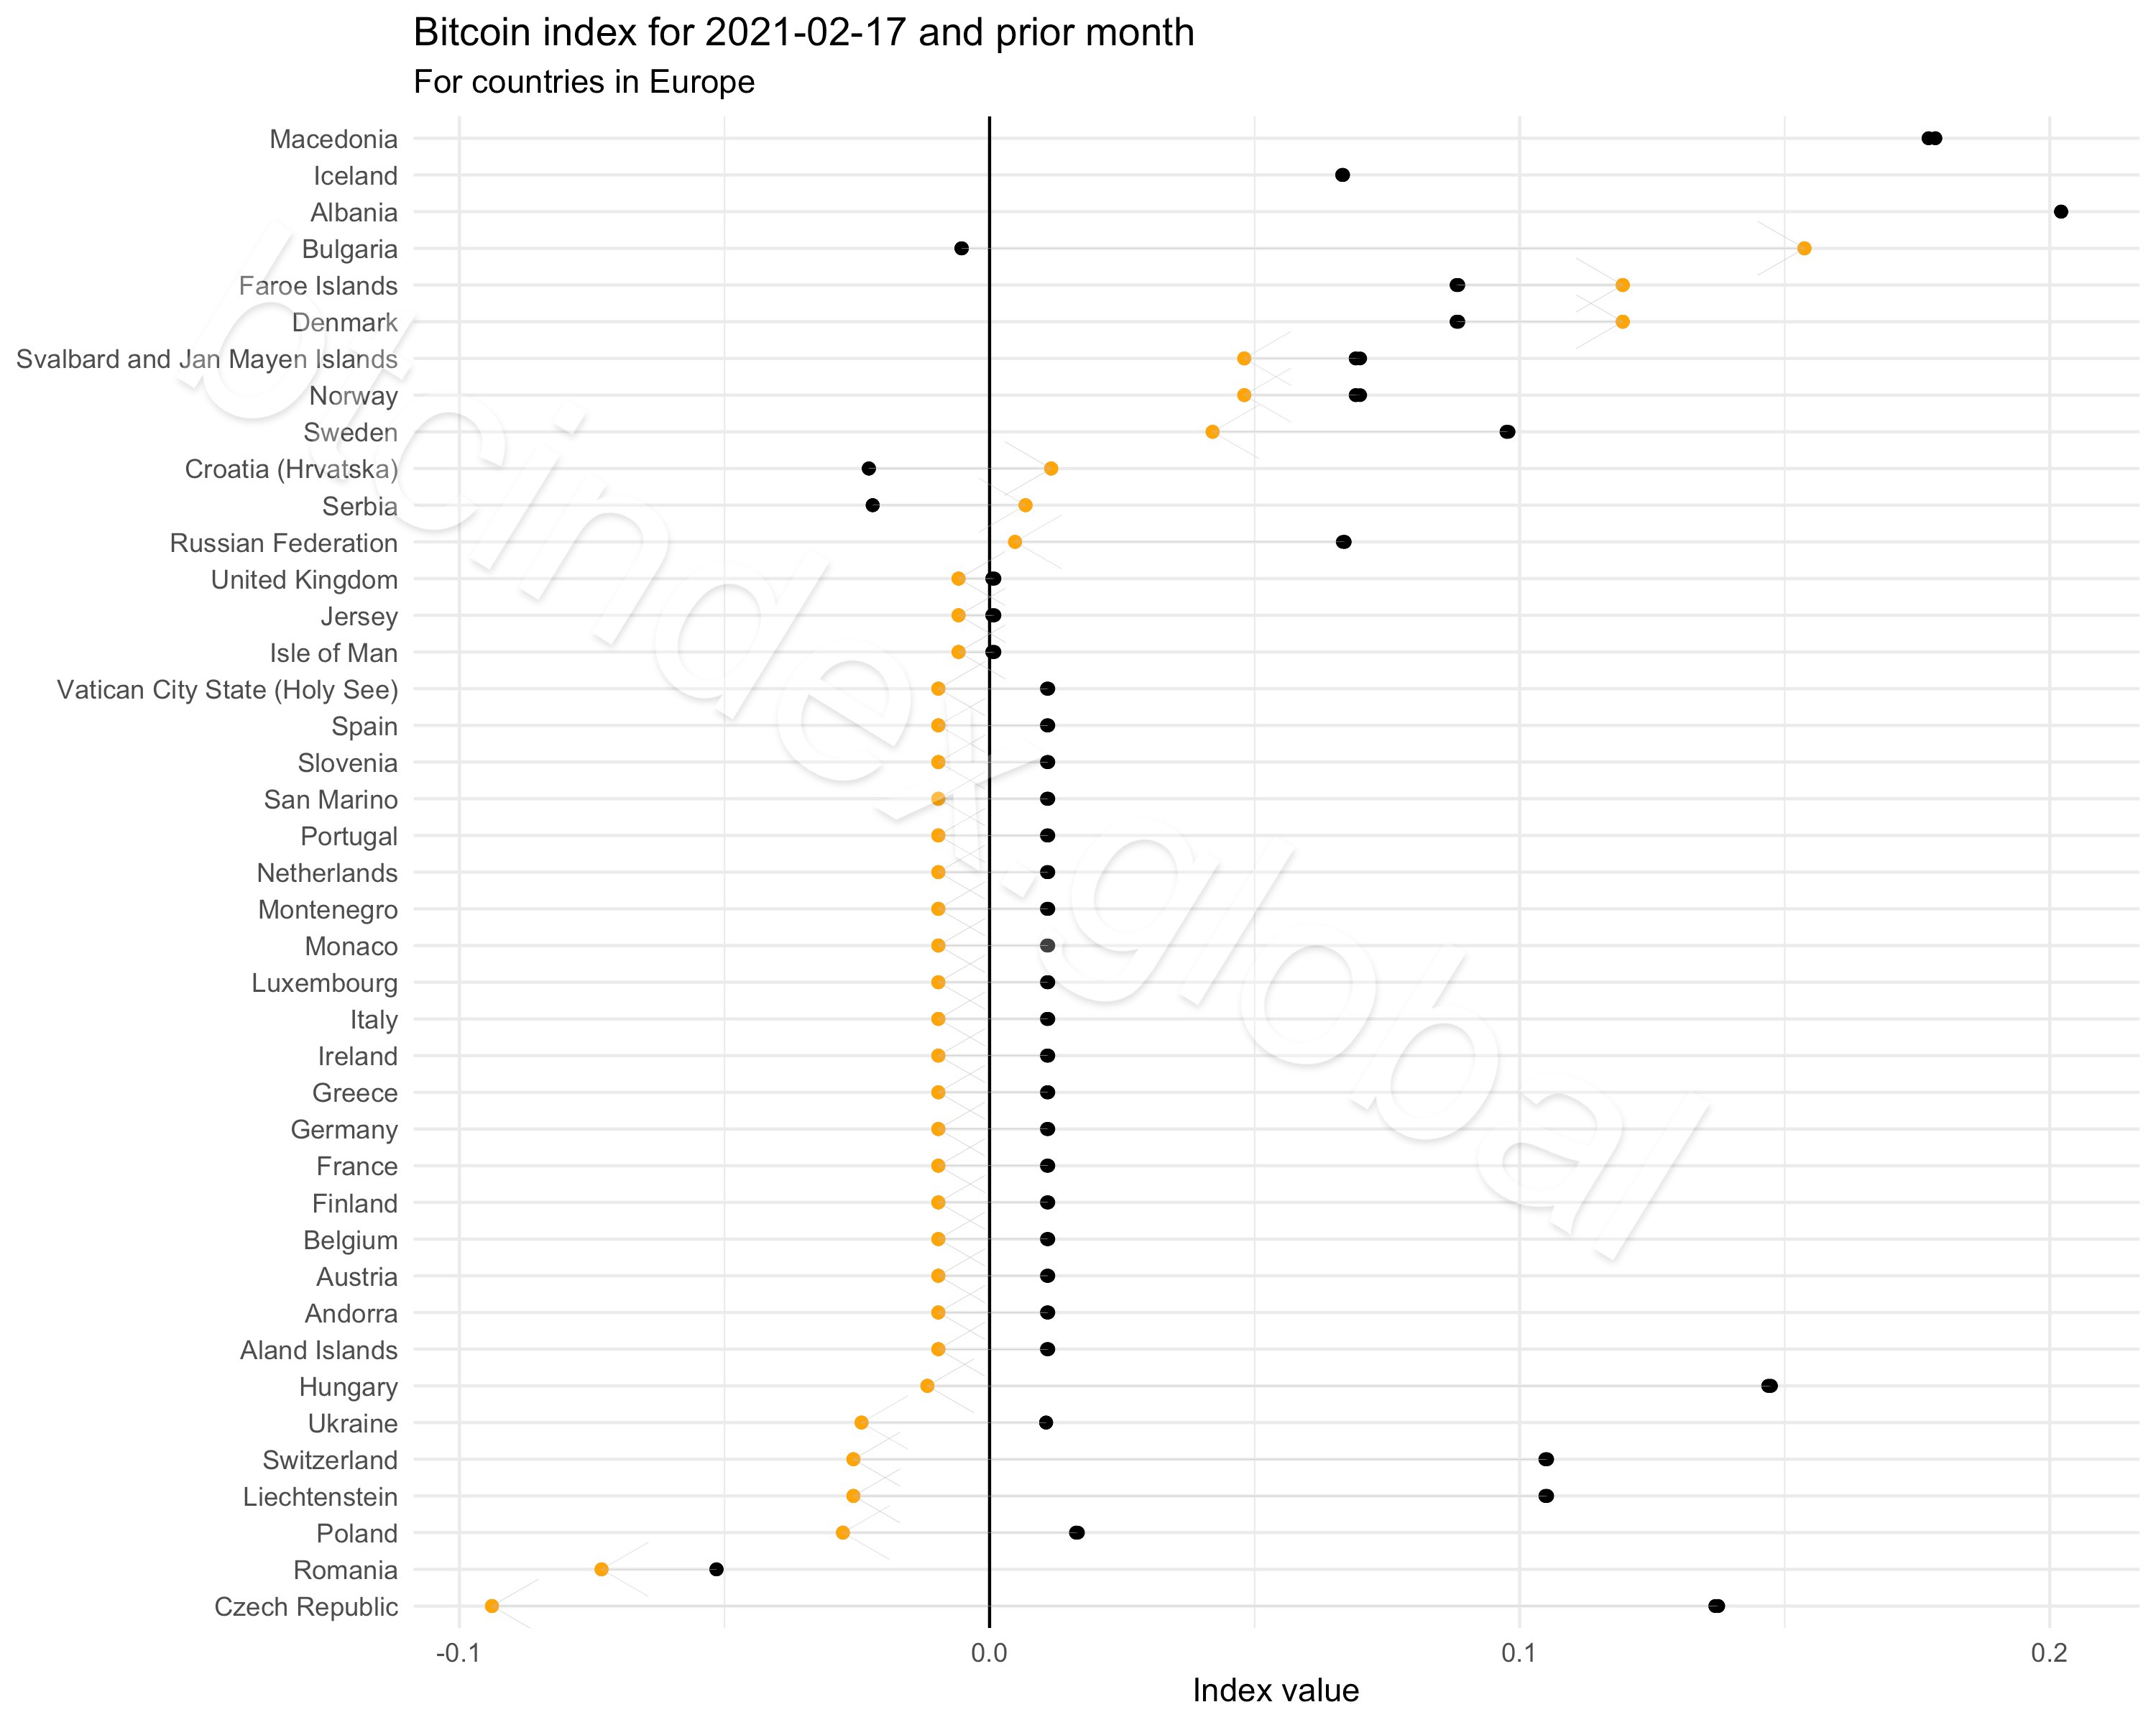
Oman & Czech Republic: these markets are where bitcoins were selling at the largest discount last month. In the latter case, this is part of a now medium-term trend whereby the Czech Koruna has been strengthening in official terms against the USD while, at the same time, bitcoins have gone from selling at a premium to selling at a discount.
Colombia: bitcoins continue to sell at a discount in Colombia. This has been the case for a very long time - it is almost unique worldwide. The obvious reason for this trend has to do with neighbouring Venezuela. Anecdotally, banks in Colombia are now allowed to sell bitcoins to account holders. This is very different to the situation back in 2019.
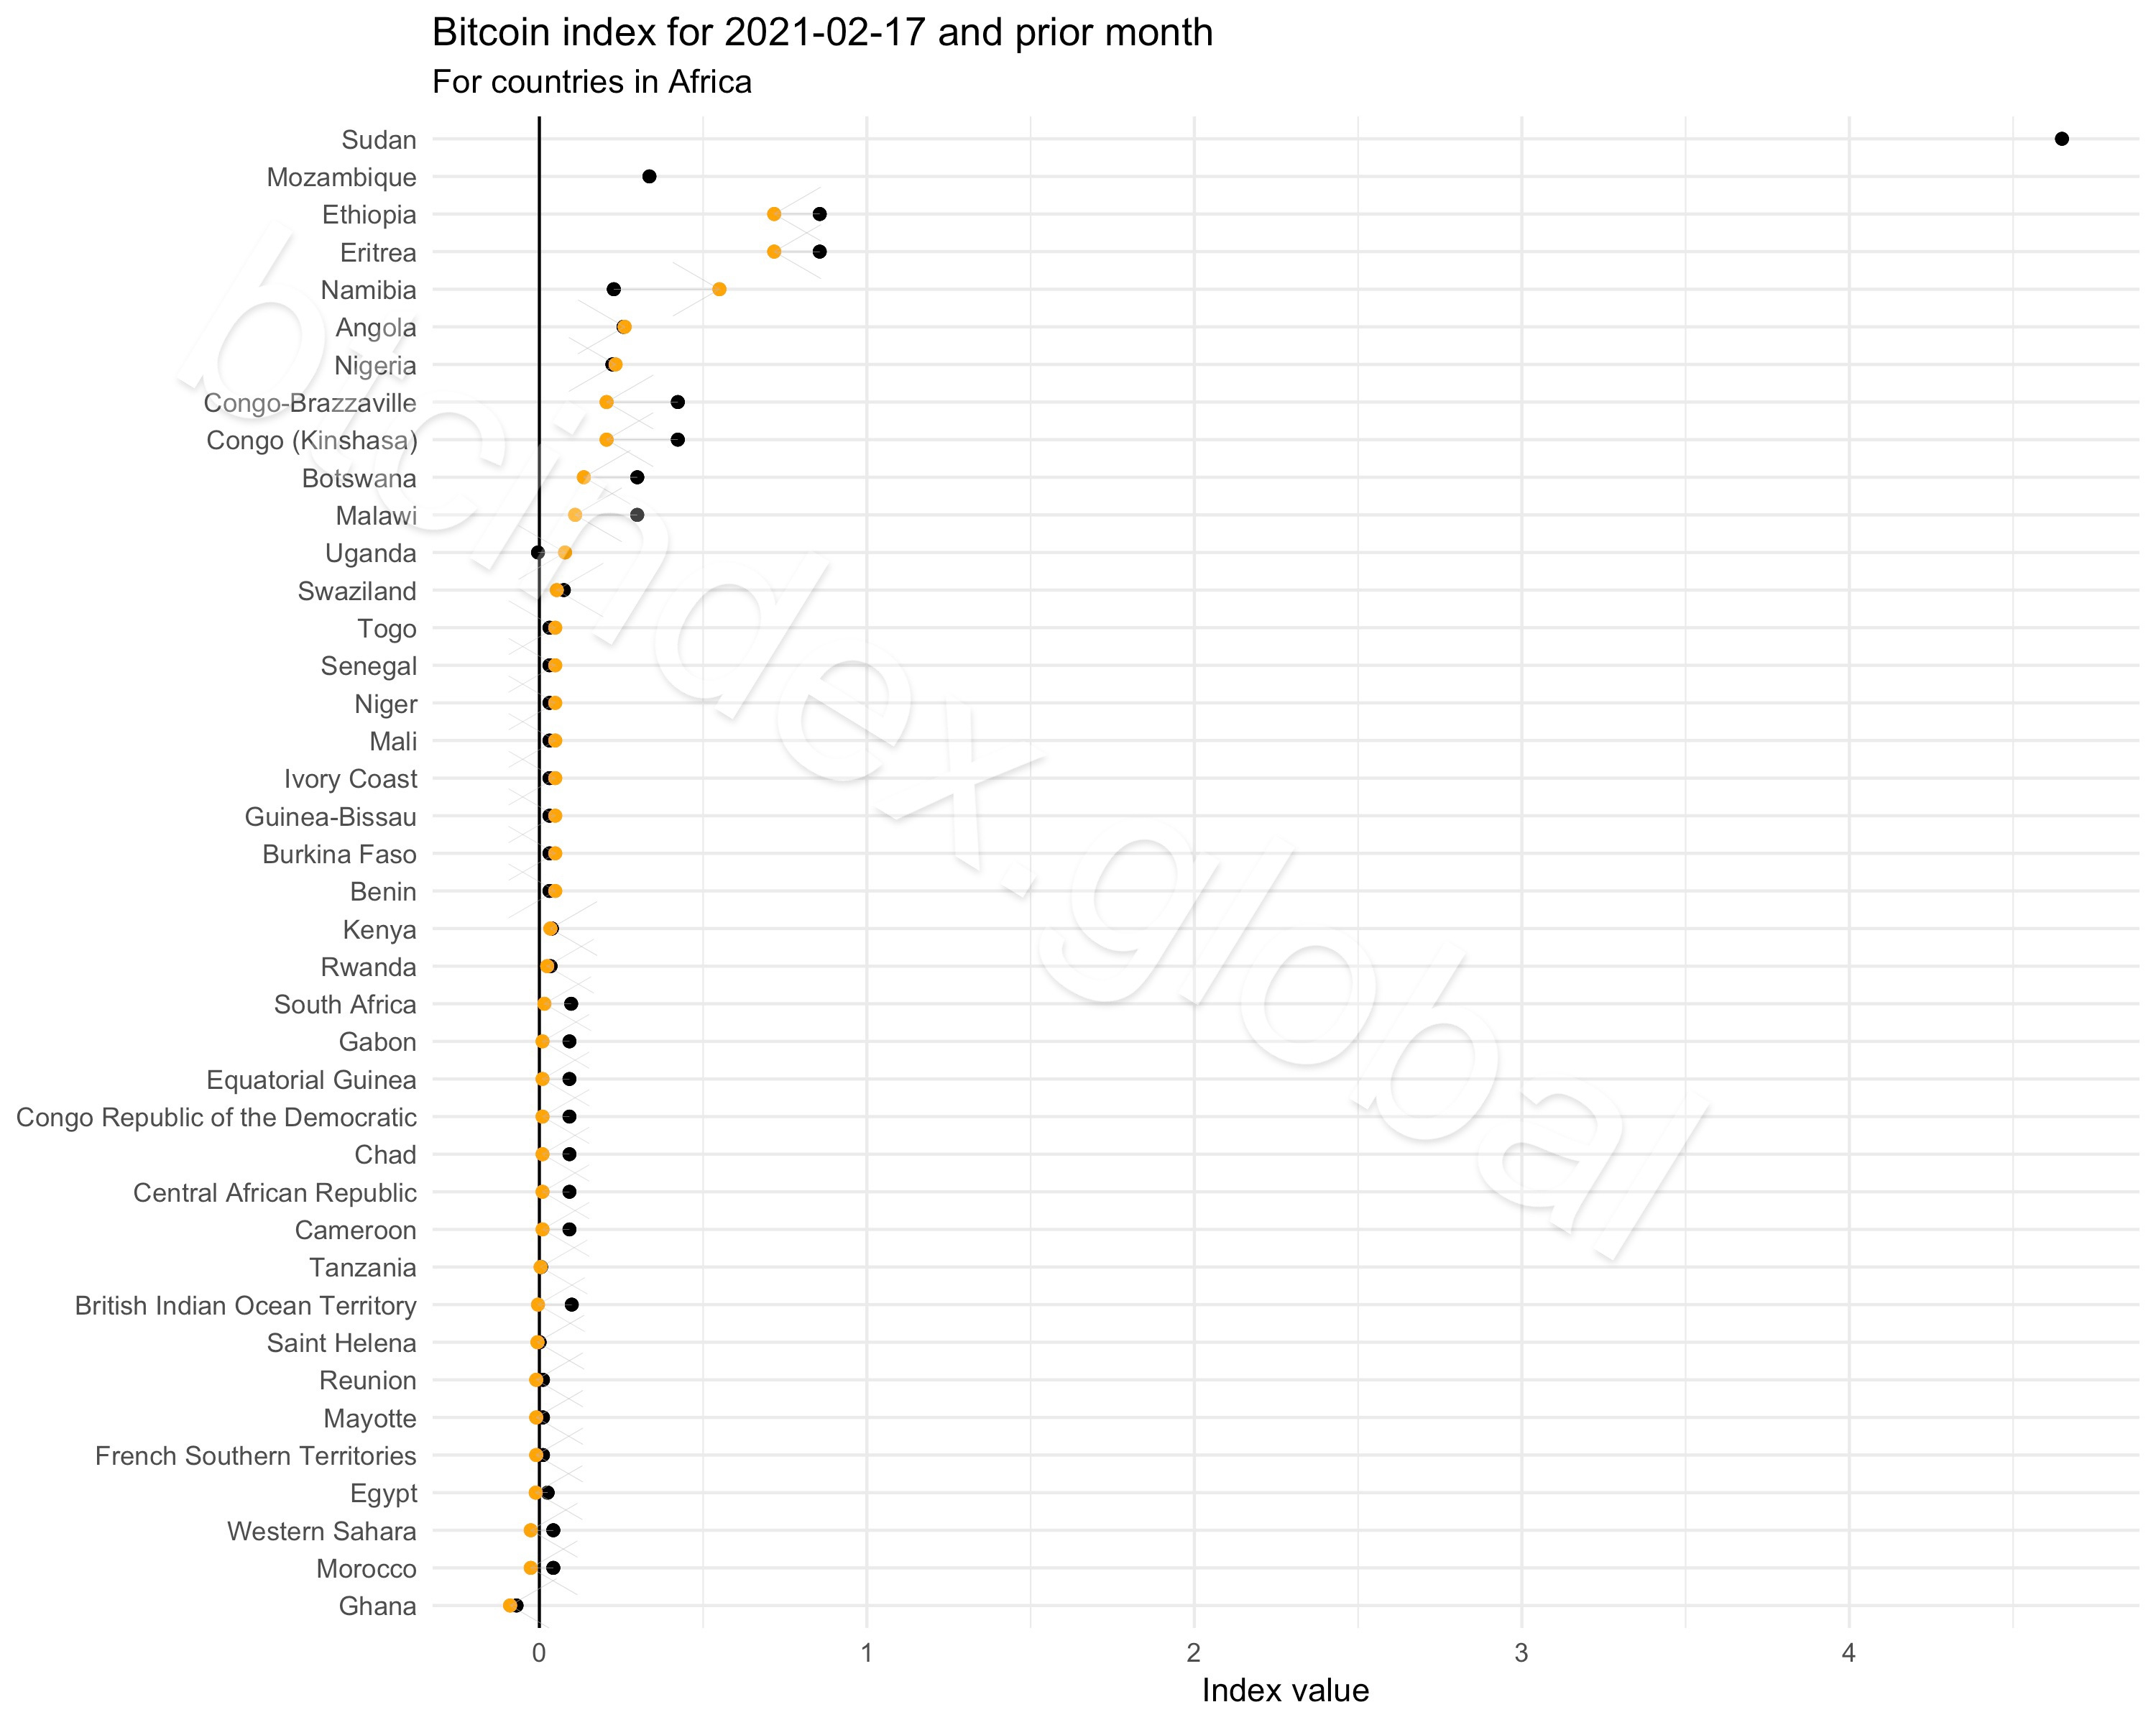
Ethiopia and Eritrea: the Bitcoin Index continues to narrow, which is a good sign given its recent spike occurred around the time a civil war erupted in late 2020. Digging under the surface though, the official exchange rate of the Ethiopian Birr has been depreciating against the USD for some time now. The implied rate is deteriorating even faster though… much faster.
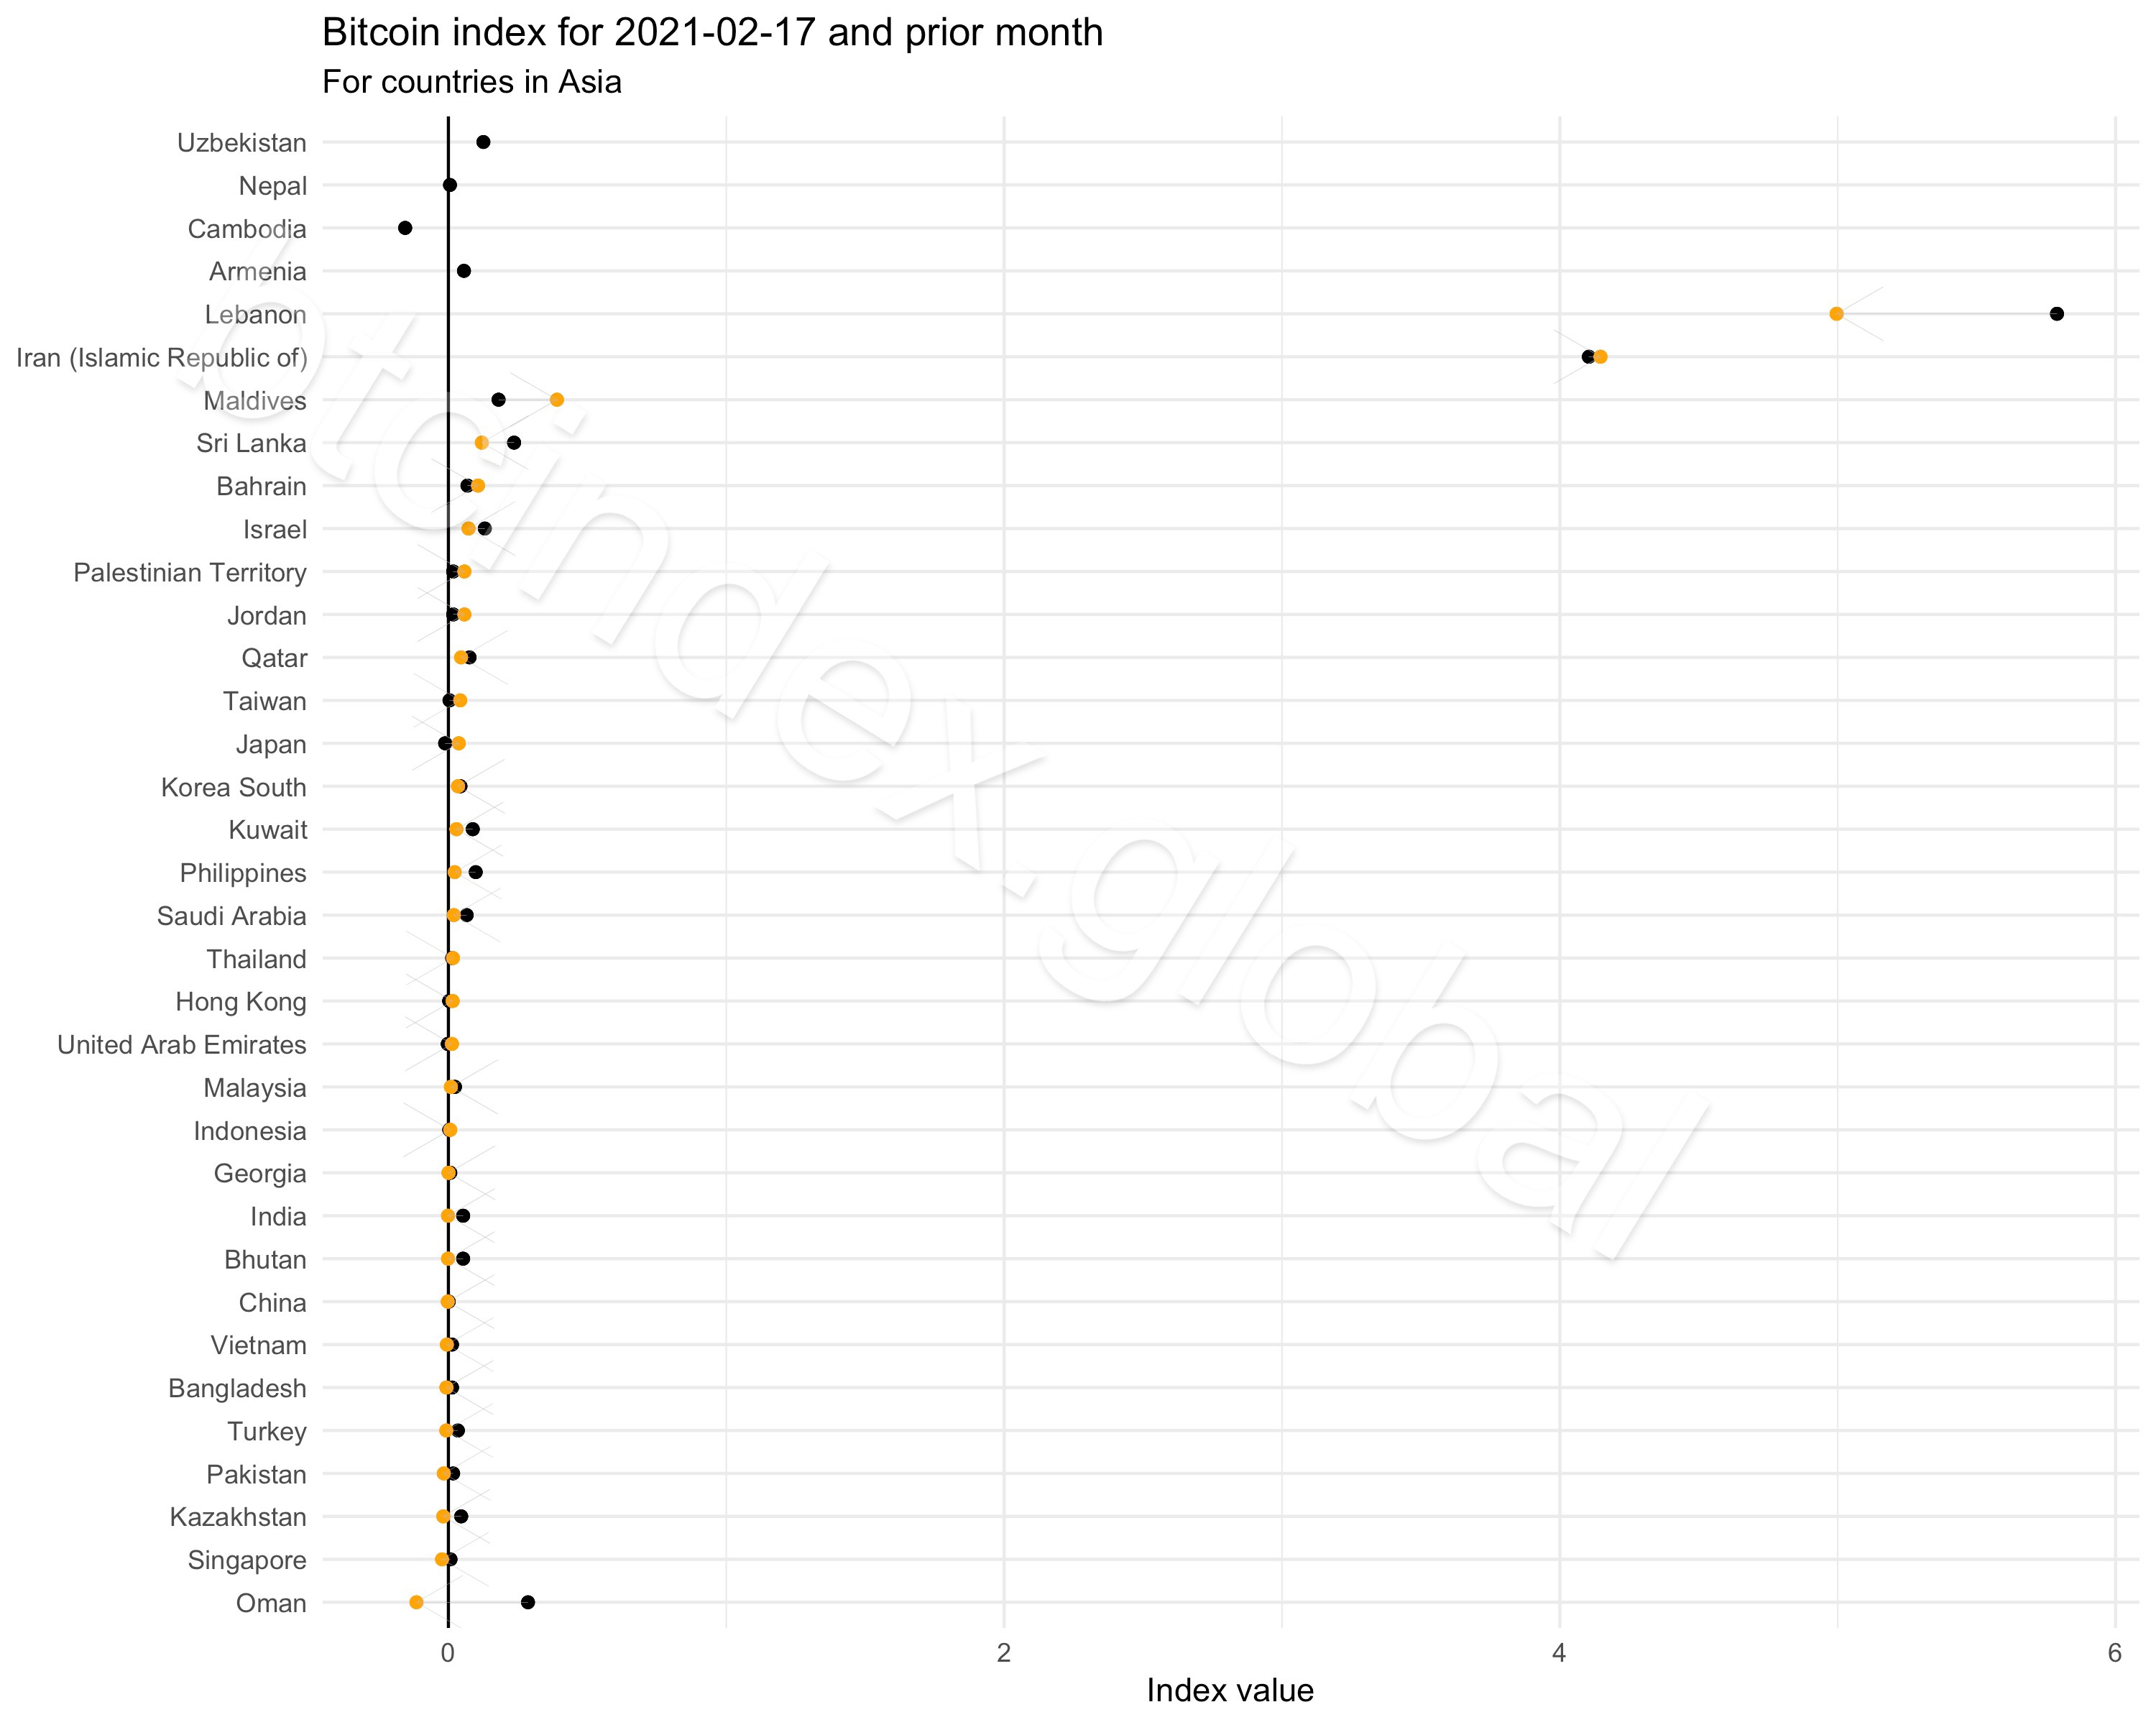
Lebanon: where in spite of the continued deterioration in the value of the LBP against the USD, the Bitcoin Index has slightly narrowed. This means that there is still a premium paid for bitcoins though that premium is decreasing.
Asia
Americas

Africa
Europe
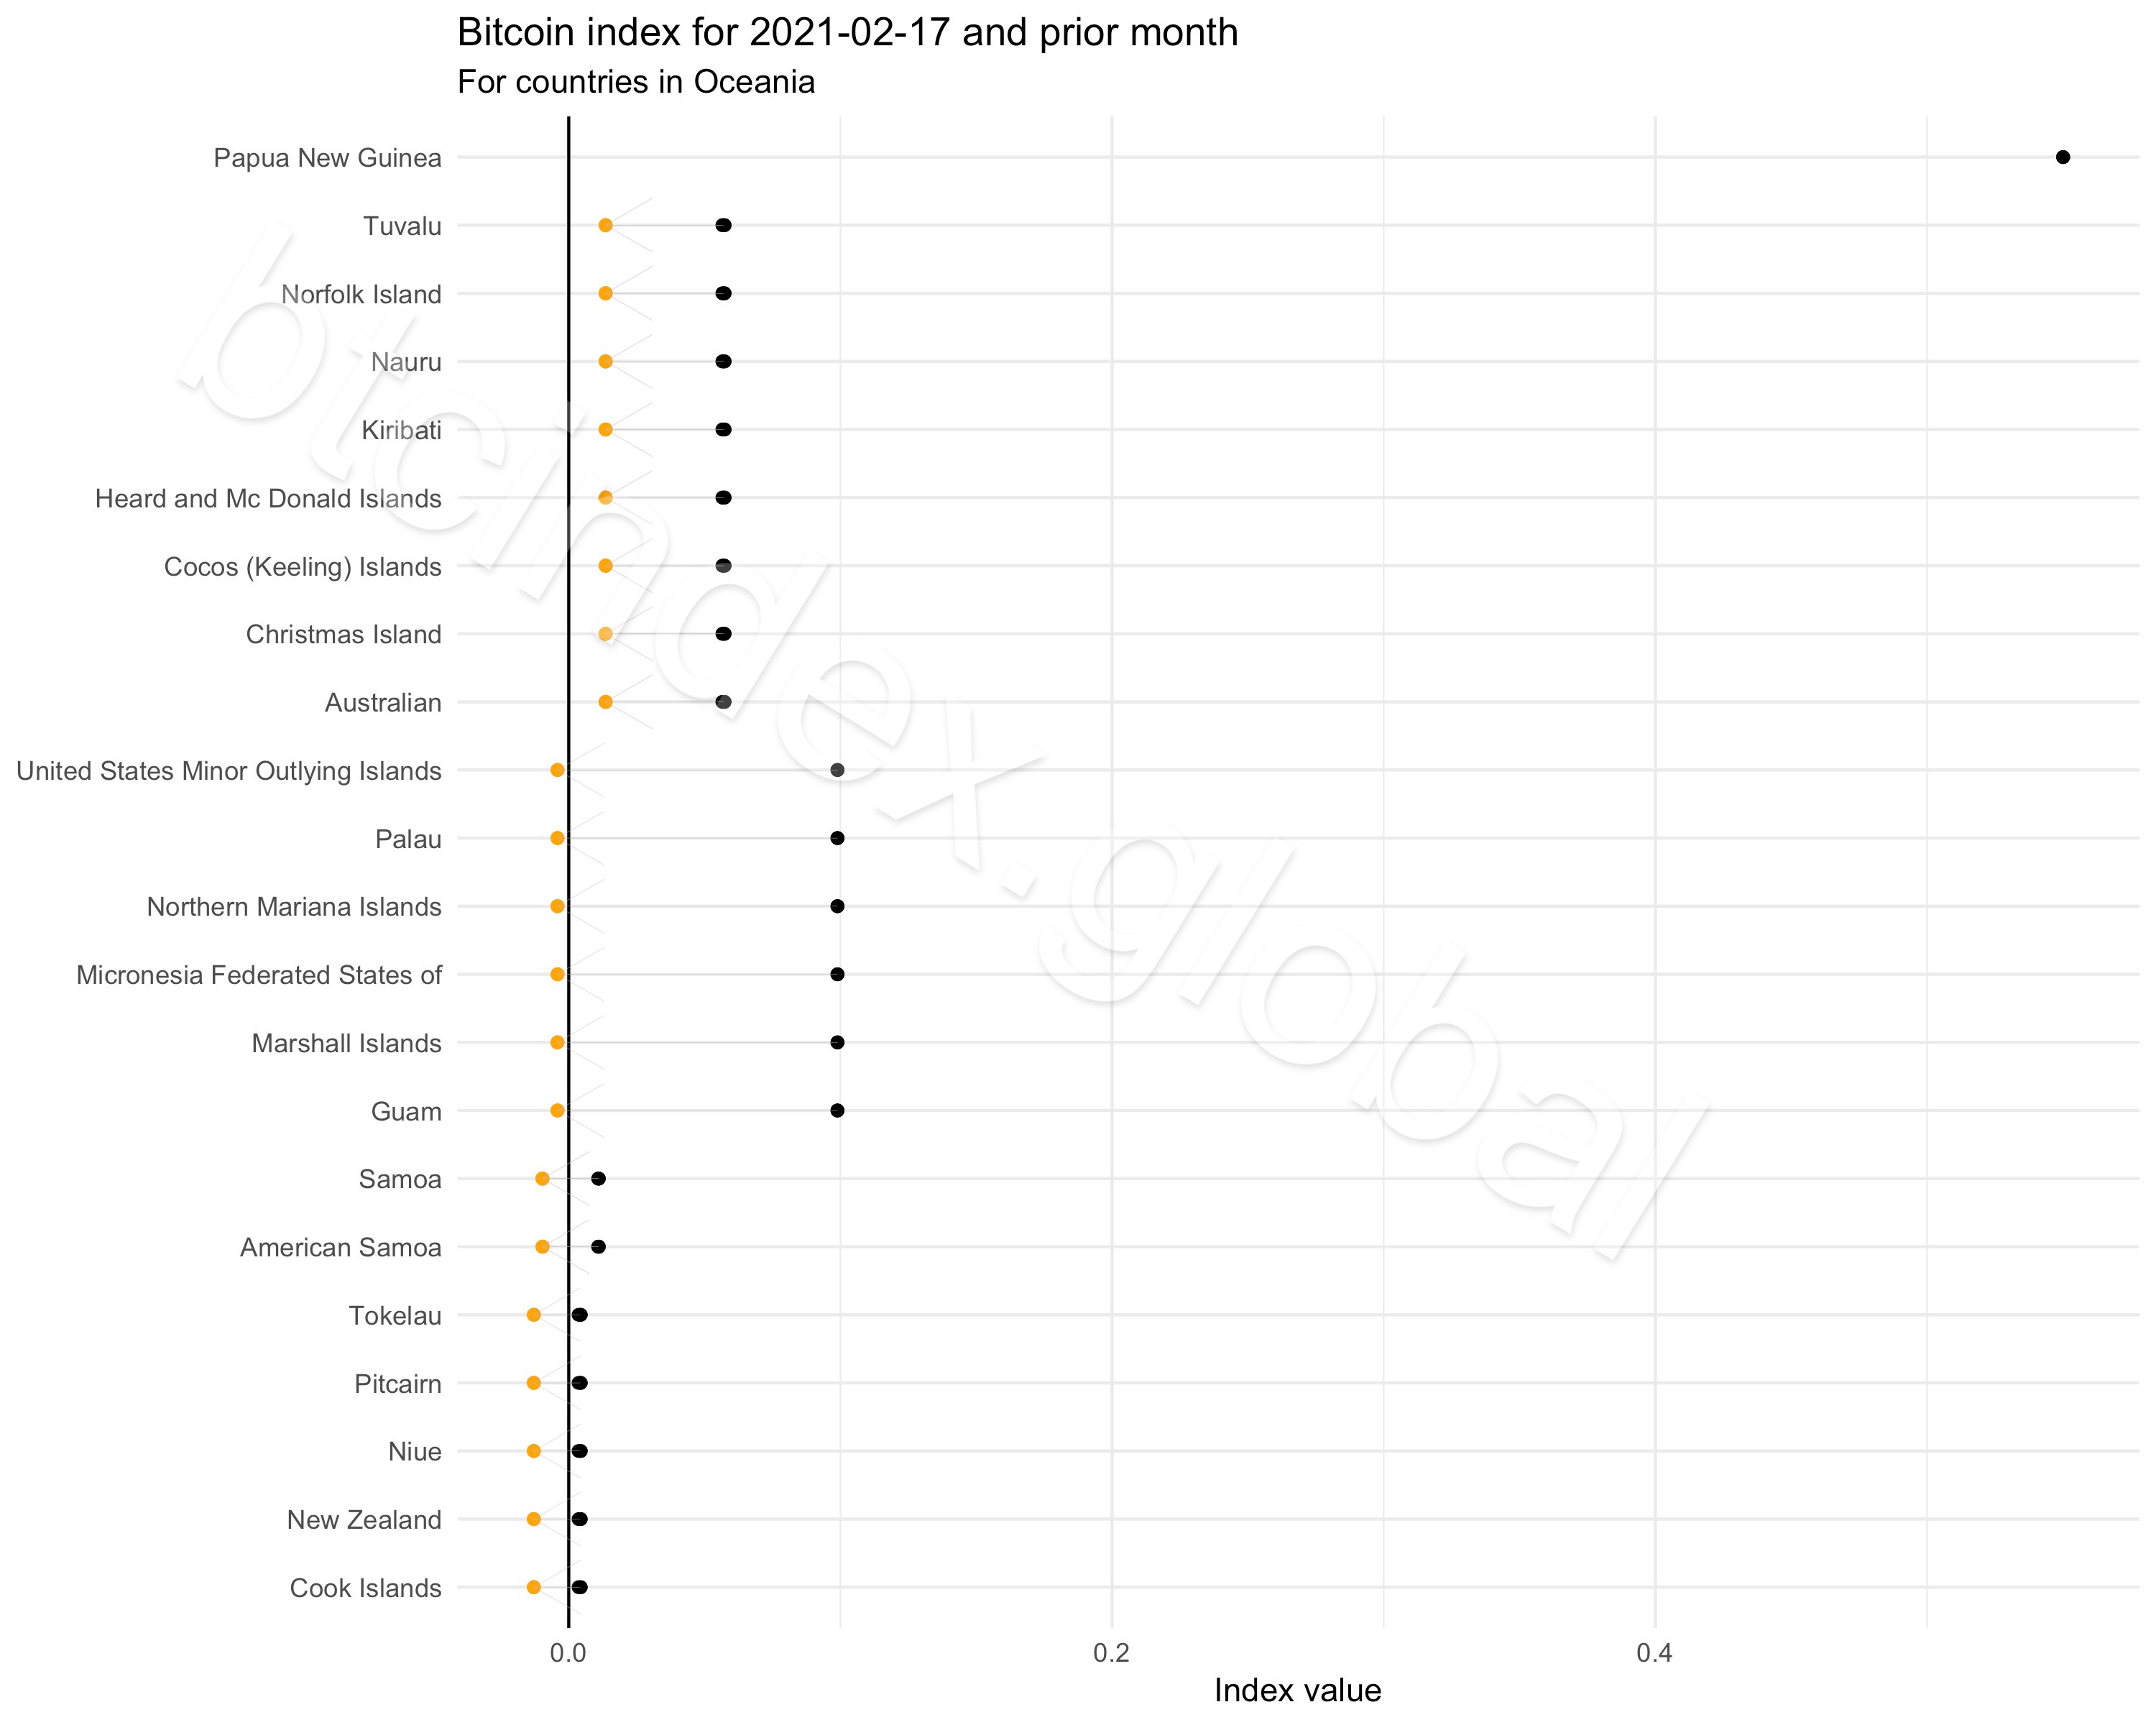
Oceania
Past months
Subscribe for auto-updates…
That’s it for this first monthly bulletin of the btc index. Each month a new bulletin will be posted with insights about why deviations and changes are seen across countries and currencies.